Kathmandu
Friday, July 17, 2026





NRB's Financial Stability Report 2024/25 shows capital ratios holding steady, but non performing loans have tripled in three years, stress tests show over half of commercial banks buckling under moderate credit shocks, and blacklisted borrowers have crossed 130,000, even as banks post record profits.

KATHMANDU: As Nepal enters fiscal year 2026/27, Nepal Rastra Bank’s seventeenth Financial Stability Report, covering the year ended mid July 2025, paints a two track picture of the banking system.
Capital adequacy, liquidity and leverage all sit comfortably above regulatory floors. But asset quality, the health of the loan book itself, has deteriorated steadily since 2022, with the non performing loan ratio climbing from 1.31 percent to 4.62 percent in just three years. NRB itself calls this “the single largest challenge” facing the sector.
This explainer breaks down what the numbers mean, how deep the stress runs and what the central bank’s own stress tests reveal about the system’s ability to absorb further shocks.
What exactly is the Financial Stability Report, and why should ordinary people care about it?
The Financial Stability Report is Nepal Rastra Bank’s annual health check-up of the entire financial system i.e., banks, development banks, finance companies, microfinance institutions, insurance companies, provident funds, cooperatives, and the plumbing that connects them, such as payment systems and the credit information bureau.
This seventeenth issue is based on provisional data up to mid-July 2025, the end of fiscal year 2024/25, compiled by NRB’s Banks and Financial Institutions Regulation Department. It matters to ordinary people because banks are where their savings, remittances and loans live. When NRB itself says asset quality has become the top vulnerability in the system, it is effectively warning that the loans banks have made to businesses, to homebuyers, to importers are increasingly not being repaid on schedule. That has knock-on effects for interest rates, credit availability, and ultimately the deposits people hold.
The report is also a policy document: it shapes what regulatory tightening or forbearance NRB considers next, including capital buffers, provisioning rules and directed lending quotas. Reading it is essentially reading the central bank’s own assessment of where the system’s weak points are before they become visible in daily banking.
What is the single most important number in this report?
That number is 4.62 percent: the non-performing loan (NPL) to total loan ratio for the entire banking and financial institution (BFI) industry as of mid-July 2025, up from 3.86 percent a year earlier. In rupee terms, NPLs across BFIs rose to Rs 258.19 billion in mid-July 2025 from Rs 199.66 billion in mid-July 2024, an increase of roughly 29 percent in a single year.
Source: Financial Stability Report, Nepal Rastra Bank.
NRB’s own language is unusually direct on this point: it states that “the degradation of asset quality has emerged as the single largest challenge currently confronting the banking system.” This is significant because unlike capital adequacy or liquidity, which are largely policy-driven buffers that banks can choose to hold, the NPL ratio reflects what is actually happening in the real economy — whether businesses and households can service the debt they took on.
A rising NPL ratio during a period of otherwise “recovering” GDP growth signals that the recovery has been uneven, and that stress has been building in borrowers’ repayment capacity for some time, only now surfacing fully on bank balance sheets.
How fast has this deteriorated? Is this a one-year blip or a longer trend?
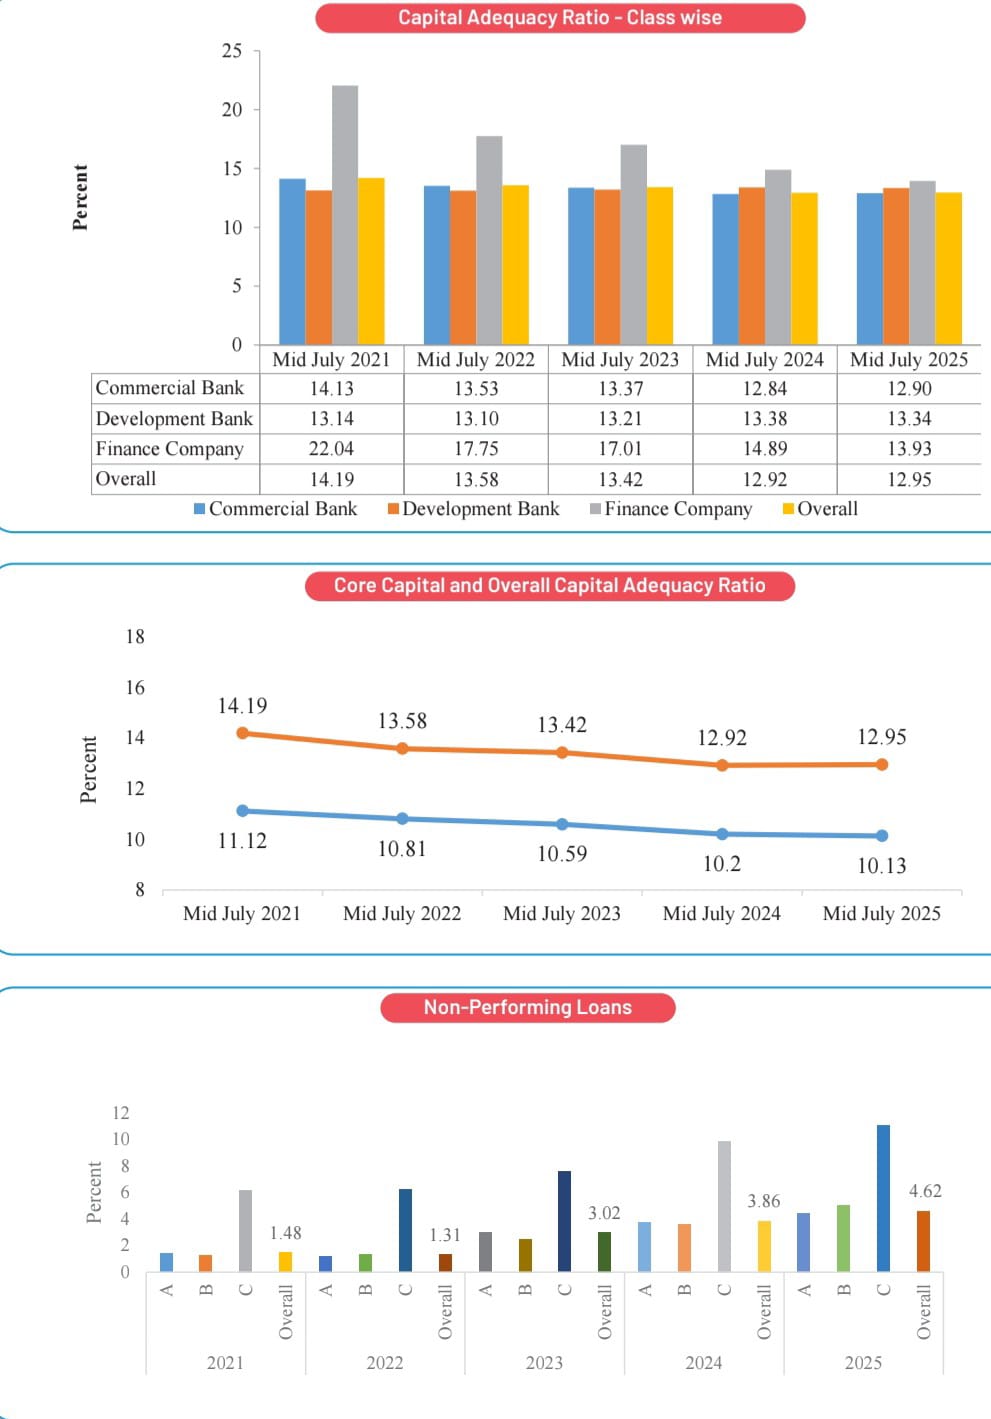
It is a clear multi-year trend, not a one-off. NRB’s own five-year chart of the overall NPL ratio shows: 1.48 percent in mid-July 2021, 1.31 percent in mid-July 2022, 3.02 percent in mid-July 2023, 3.86 percent in mid-July 2024, and 4.62 percent in mid-July 2025. In other words, the NPL ratio has more than tripled since its low point in 2022, and it has risen in every year since.
The Banking Stability Indicator, a composite risk score NRB itself constructs, tells the same story from another angle: its asset-quality sub-index rose from 0.32 in mid-2022 to 0.89 in mid-2025, where a higher score signals higher risk. That is one of the sharpest deteriorations among all six components NRB tracks.
This steady, multi-year climb, rather than a sudden spike, suggests the erosion in loan quality has structural roots: slow private-sector credit growth, underutilized capital spending by government, and softening repayment capacity across several sectors, rather than a single shock event.
What does “asset quality” actually mean, and why is it different from capital adequacy?
Asset quality refers to how much of a bank’s loan portfolio, its main “asset,” is actually performing, meaning borrowers are repaying principal and interest on schedule. Capital adequacy, in contrast, measures how much of a cushion (shareholder capital and reserves) a bank holds against its risk-weighted assets, to absorb losses if things go wrong.
Source: Financial Stability Report, Nepal Rastra Bank.
NRB’s report draws this distinction explicitly: banks remain “well-capitalized,” with the overall capital adequacy ratio at 12.95 percent and core capital ratio at 10.13 percent as of mid-July 2025, both above regulatory minimums. But the report warns that “the deterioration of asset quality has raised concerns over the ability to maintain capital adequacy,” meaning the cushion could shrink if bad loans keep growing, because banks must set aside more provisions (loan-loss reserves) against non-performing loans, and those provisions come directly out of capital and profit.
So while the two indicators look contradictory at first glance, strong capital, weak asset quality, they are connected: today’s strong capital ratio is partly a lagging indicator that hasn’t yet fully absorbed tomorrow’s provisioning costs from today’s bad loans.
Which sectors of the economy are generating the most bad loans?
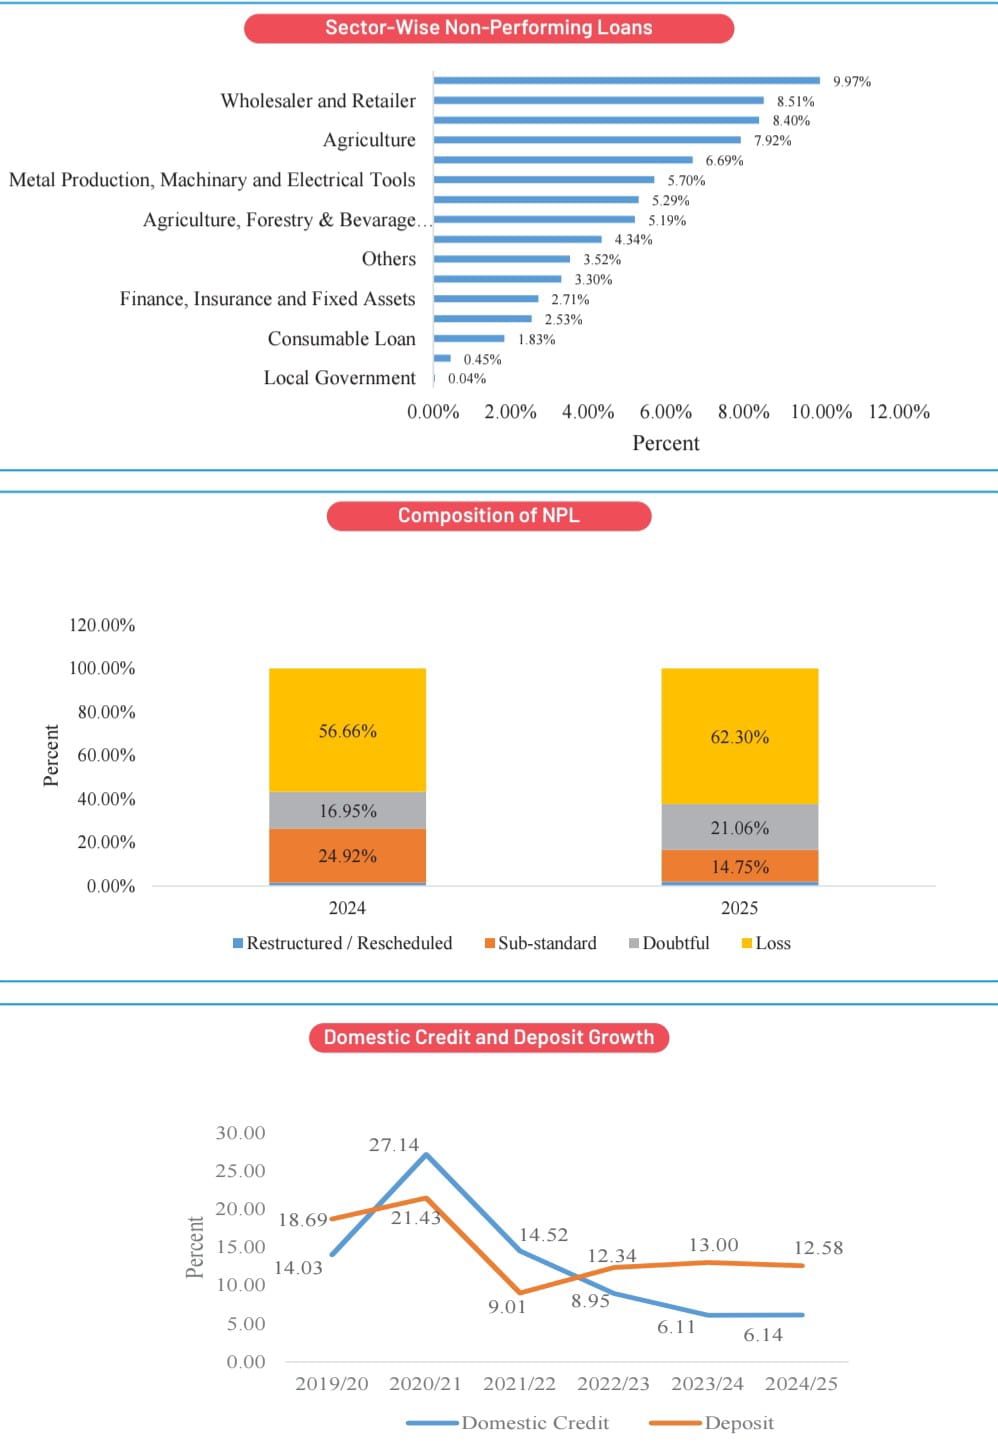
The report breaks down non-performing loans by economic sector, and the pattern points to real-economy stress rather than isolated banking mismanagement. The fishery sector recorded the highest NPL ratio at 9.97 percent, followed by wholesalers and retailers at 8.51 percent, construction at 8.40 percent, agriculture at 7.92 percent, and transportation, communications and public services at 6.69 percent.

Metal production, machinery and electrical tools stood at 5.70 percent, hotels and restaurants at 5.29 percent, and broader agriculture, forestry and beverage production at 5.19 percent. At the other end, electricity, gas and water loans showed just 0.45 percent NPL, and local government loans just 0.04 percent: both sectors that benefited from strong GDP growth in FY2024/25.
The pattern is telling: trade, construction, and agriculture — sectors most exposed to weak domestic demand, land and real estate slowdowns, and seasonal/climate risk — are where repayment capacity has weakened most, while regulated, subsidized or high-growth sectors like electricity have stayed largely clean.
Beyond the headline ratio, what is happening inside the pool of bad loans itself?
This is where the report gets more alarming than the headline ratio alone suggests. NRB classifies non-performing loans into four buckets: restructured/rescheduled, sub-standard, doubtful, and loss. The loss category i.e., loans considered essentially unrecoverable, rose to 62.30 percent of total NPLs in mid-July 2025, up from 56.66 percent a year earlier. The doubtful loans category also rose, from 16.95 percent to 21.06 percent of total NPLs.
Meanwhile, the restructured/rescheduled share, loans that had been given easier terms rather than classified as fully bad, fell from 24.92 percent to 14.75 percent. NRB’s own reading of this shift is that “the composition of NPLs shows signs of deterioration in asset quality with a rise in the non-performing loans of the loss category.”
In plain terms: not only are more loans turning bad, but a growing share of those bad loans are moving into the worst, least-recoverable bracket, rather than staying in the more salvageable restructured category. That is a sign of loans ageing past the point banks can realistically rescue them.
How do commercial banks, development banks, finance companies and microfinance institutions compare?
The deterioration is not evenly spread — it is worst at the edges of the system. Commercial banks, the largest and generally most closely supervised class, saw their NPL ratio rise to 4.44 percent in mid-July 2025 from 3.76 percent a year earlier, with a net NPL ratio (after provisioning) of 1.05 percent. Development banks saw a steeper jump, from 3.62 percent to 5.03 percent.
Finance companies, a smaller segment already carrying elevated risk, saw NPLs rise from 9.87 percent to 11.05 percent, with the rupee amount of bad loans reaching Rs 11.52 billion. The sharpest deterioration by far was in microfinance institutions (MFIs), where the NPL ratio jumped from 6.31 percent to 9.95 percent in a single year.
MFI overdue loans (loan principal plus interest overdue) rose 30.26 percent to Rs 45.93 billion, and loan-loss provisions had to rise 32.94 percent to Rs 32.41 billion to cover it. This tiered pattern — worst at MFIs and finance companies, better but still worsening at commercial banks — suggests stress is concentrated among smaller borrowers and more vulnerable institutions, even as the largest banks remain comparatively more insulated.
Are state-owned banks doing better or worse than private commercial banks?
State-owned banks (SOBs) are currently doing somewhat better on this specific metric. As of mid-July 2025, the three state-owned commercial banks — Nepal Bank Limited (NBL), Rastriya Banijya Bank Limited (RBBL), and Agricultural Development Bank Limited (ADBL) — had individual NPL ratios of 4.47 percent, 3.59 percent, and 3.26 percent respectively, giving a combined SOB NPL ratio of 3.77 percent, up from 3.47 percent the previous year.
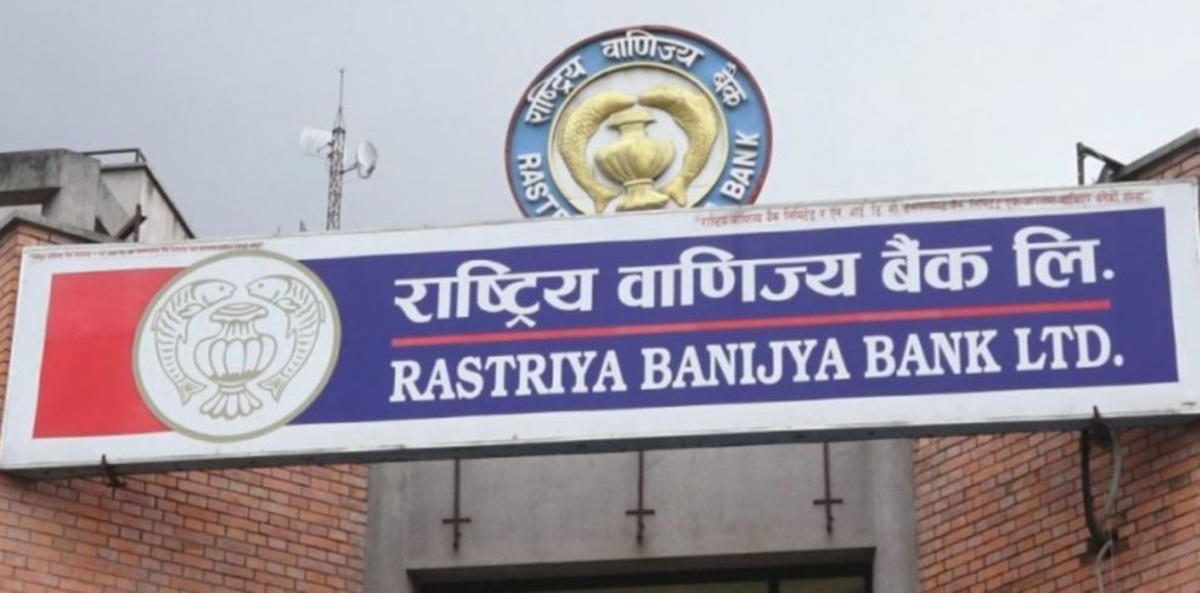
Rastriya Banijya Bank. File photo
Private commercial banks, by contrast, had a combined NPL ratio of 4.56 percent in mid-July 2025, up from 3.81 percent the year before — meaning private banks’ bad-loan ratio is now noticeably higher than the state-owned banks’ combined figure and has deteriorated by a wider margin.
On capital, the picture is more mixed: the core capital to risk-weighted assets ratio for NBL, RBBL and ADBL stood at 10.05 percent, 9.46 percent and 11.93 percent respectively, while total capital adequacy ratios stood at 13.06 percent, 11.84 percent and 13.36 percent — all comfortably above the regulatory minimum, though RBBL runs the thinnest core-capital buffer of the three state banks.
Is the banking sector still adequately capitalized despite all this?
Yes, by the regulatory yardstick, but with a caveat NRB itself flags. The overall capital adequacy ratio (CAR) for BFIs stood at 12.95 percent as of mid-July 2025, against a regulatory minimum, and the core capital ratio stood at 10.13 percent — both comfortably above the floor. The leverage ratio, a simpler measure of capital against total (non-risk-weighted) assets, stood at 6.46 percent for commercial banks and 7.68 percent for national-level development banks, both above the 4 percent minimum requirement.
However, the report notes a “declining trend” in capital adequacy: the core capital ratio has slipped from 10.20 percent to 10.13 percent year-on-year, continuing a longer slide from 11.12 percent in mid-2021.
NRB explicitly frames this as a supervisory concern, not because banks are currently undercapitalized, but because sustained NPL growth forces higher loan-loss provisioning, which eats directly into retained earnings and, over time, into the capital base itself: meaning today’s comfortable buffer could erode faster than expected if asset quality does not stabilize.
What did Nepal Rastra Bank’s stress tests actually find?
NRB ran a battery of stress tests on all 20 commercial banks as of mid-July 2025, simulating credit shocks, liquidity shocks, market shocks and operational shocks. Before any shock, all 20 banks had a CAR at or above the 11 percent regulatory threshold, and 15 of 20 already had NPL ratios below 5 percent.
But even a moderate credit shock changed this sharply: if just 15 percent of “pass” (currently performing) loans were downgraded to substandard, every single one of the 20 banks would see its NPL ratio exceed 5 percent, and six banks would see their CAR fall into the 8.5–11 percent band, below the comfortable zone.
The most severe scenario tested, a combination of five different credit-deterioration assumptions applied together, pushed eight banks below the 8.5 percent CAR threshold entirely, left eleven in the 8.5–11 percent band, and left only one bank still comfortably above 11 percent. In other words, under a combined, moderately severe credit-deterioration scenario, essentially none of the 20 commercial banks would remain unambiguously well-capitalized.
What about liquidity — could a bank run actually happen?
The report also modelled deposit-withdrawal scenarios. Under a scenario of customers withdrawing 2, 5, 10, 10 and 10 percent of deposits on five consecutive days, two of the 20 commercial banks would become illiquid by the end of the fifth day. If depositors withdrew 20 percent of non-fixed deposits in a single day, twelve banks would see their net liquid assets ratio fall below the 20 percent regulatory minimum.

Representative image
The report also flags concentration risk: most banks depend heavily on a small number of large depositors, and if the top five institutional depositors alone withdrew their funds, six banks would face liquidity problems. These are stress-test scenarios, not predictions of an imminent run, and NRB’s own liquidity data shows the system is currently comfortable — the net liquid assets to total deposits ratio stood at 34.33 percent, well above the 20 percent regulatory floor.
But the tests show that liquidity comfort today rests significantly on the assumption that large depositors do not move in a coordinated way, which is a narrower safety margin than the headline ratio suggests.
NRB has a “Banking Stability Indicator.” What does that composite score show?
The Banking Stability Indicator (BSI) is NRB’s attempt to combine six separate risk dimensions — soundness, profitability, liquidity, sensitivity, efficiency, and asset quality — into a single composite score, where a higher score means higher overall risk. The composite index has risen steadily from 0.36 in mid-July 2022 to 0.41 in mid-2023, 0.56 in mid-2024, and now stands at 0.55 in mid-2025 — a marginal dip year-on-year, but still nearly 53 percent higher than three years ago.
Breaking down the mid-2025 score by component: asset quality scored 0.89 (the highest risk reading of any component, up from 0.71 the year before), soundness scored 0.66, efficiency 0.75, sensitivity 0.49, profitability 0.47, and liquidity just 0.04, the lowest-risk reading across the board.
NRB’s own commentary states the rising composite index “depicts the increased level of overall risk in banking stability,” while singling out asset quality, profitability and sensitivity as the areas where “risks… have been sticky at a higher side,” even as liquidity has stayed comfortable throughout.
If bad loans are rising, how are banks still reporting profits?
This is one of the more counterintuitive findings in the report. Despite the NPL surge, the BFI sector as a whole recorded a net profit of Rs 77.53 billion in mid-July 2025, a 10.07 percent increase over the previous fiscal year. Within this, commercial banks alone posted a net profit of Rs 71.51 billion, up 11.47 percent.
Return on equity for the overall BFI sector actually improved, rising to 10.00 percent from 9.67 percent, even as return on assets dipped slightly to 0.85 percent from 0.87 percent. Part of the explanation lies in interest income still flowing from a large loan book even as new lending slows, alongside cost efficiencies; but it is worth noting this is happening even as loan-loss provisioning needs are rising, and even as the report’s own profitability sub-index within the Banking Stability Indicator sits at 0.47 — a middling-to-elevated risk score, not a picture of unambiguous strength.
Profit growth today is, in effect, partly a lagging cushion that provisioning costs from a worsening loan book have not yet fully caught up with.
What is happening to loan defaulters — is blacklisting rising too?
Sharply, yes. The number of borrowers blacklisted by Nepal’s Credit Information Bureau rose from 16,987 in fiscal year 2020/21 to 129,974 by fiscal year 2024/25 — a more than seven-fold increase in four years. The annual growth rate of new blacklistings peaked at 90 percent in fiscal year 2022/23, and while it has since moderated, it still stood at 37.5 percent in fiscal year 2024/25, meaning the pool of blacklisted borrowers is still expanding rapidly even if the pace has slowed from its post-pandemic peak.

Blacklisting is a formal regulatory status applied when a borrower fails to service secured or unsecured credit obligations for a defined period, and it typically restricts that individual or firm’s access to future formal credit, professional licenses, and in some cases foreign travel for business purposes.
This rapid rise in blacklisted borrowers runs parallel to, and helps explain, the rise in NPLs — it is the borrower-side mirror image of the bank-side asset-quality numbers, both pointing to the same underlying deterioration in repayment capacity across the economy.
What is the broader macroeconomic backdrop against which this is happening?
Nepal’s GDP growth rose to 4.61 percent in fiscal year 2024/25, up from 3.67 percent the previous year, driven mainly by electricity and gas, transportation and storage, and financial and insurance sectors. Inflation eased to 4.06 percent from 5.44 percent.
The external sector was a bright spot: remittance inflows rose 19.2 percent and the balance of payments stayed favorable. Yet credit growth to the private sector from BFIs was just 8.4 percent for the year — described in the report as having “fallen short of projection” — while deposits grew faster, at 12.6 percent, leaving banks awash with liquidity they are struggling to lend out productively.
The report also flags persistent underutilization of government capital expenditure as a structural drag on the economy. More recent in-year data cited in the report shows this credit slowdown continuing into fiscal year 2025/26: private sector credit grew by just Rs 312.00 billion (5.7 percent) in the first ten months, compared to Rs 368.68 billion (7.3 percent) in the same period a year earlier, even as deposits grew faster still.
This combination — ample liquidity, soft credit demand, and rising defaults among existing borrowers — is the macro-financial context in which the asset-quality problem is unfolding.
Does Nepal’s placement on the FATF grey list connect to this story?
It is a related but distinct vulnerability the same report documents. In February 2025, the Financial Action Task Force (FATF) placed Nepal on its list of “Jurisdictions under Increased Monitoring” — commonly called the grey list — following a mutual evaluation process that began in 2022/23 and an International Cooperation Review Group process from October 2023.

File Photo
This is the second time Nepal has faced this designation, the first being from 2008 to 2014. In response, the Government of Nepal issued the Asset (Money) Laundering Prevention Rules, 2024 and rolled out a third National Strategy and Action Plan on AML/CFT covering 2024/25 to 2028/29.
While grey-listing is primarily about anti-money-laundering and counter-terrorism-financing controls rather than loan quality directly, it matters for the same broader financial-stability picture: it raises the cost and friction of Nepal’s international financial transactions, including correspondent banking relationships that Nepali banks rely on for trade finance and remittances, at a time when the domestic loan book is already under strain.
What does NRB itself recommend, and does the report suggest any imminent crisis?
NRB’s language is calibrated, not alarmist. Its overall conclusion is that “the domestic financial system remained broadly resilient over the review year,” pointing to capital adequacy, liquidity and leverage ratios all sitting comfortably above regulatory minimums.
But it pairs that reassurance with a clear warning that “the ongoing deterioration in asset quality warrants increased supervisory vigilance,” and calls for “continued prudent, forward-looking, and well-coordinated regulatory oversight across the financial sector” to preserve stability while still supporting credit growth. This is a “watch closely, not panic” framing: the report is not describing a banking crisis in progress, but it is explicitly flagging asset quality as the fault line most likely to determine whether current stability holds.

Nepal Rastra Bank,Thapathali. File photo
The stress test results reinforce this — the system passes comfortably under baseline and mild-shock conditions, but shows meaningful cracks under compounded, moderately severe credit-shock scenarios, which is precisely the kind of scenario a continued NPL uptrend could bring closer to reality rather than further away.
So, in plain terms, how worried should depositors and the public actually be?
Based strictly on what this report shows, depositors’ money is not at acute risk today: liquidity ratios are comfortable, deposit insurance exists through the Deposit and Credit Guarantee Fund (which guaranteed 57.13 million deposit accounts worth Rs 1,579.05 billion as of mid-July 2025), and capital ratios remain above regulatory floors across nearly all institutions.
The more relevant worry for the public is systemic and forward-looking rather than immediate: if the NPL trend that has now run for three consecutive years continues, banks will need to keep raising loan-loss provisions, which pressures profitability and, eventually, capital ratios — precisely the chain reaction NRB’s own stress tests model under moderate shock scenarios.
It is also a worry for the real economy rather than just banks: rising NPLs both reflect and reinforce weak private-sector credit growth, meaning businesses may find it harder or costlier to borrow even as banks sit on ample liquidity.
The report’s own framing — resilient today, but with asset quality as the clear fault line to watch — is the most accurate one-line summary available directly from the data.