
Kathmandu
Friday, July 24, 2026





Driven by imports of fuel, raw edible oils and electronics, Nepal's growing imports have widened the trade gap despite double-digit export growth, with total foreign trade crossing Rs 2.41 trillion and India and China accounting for 78% of the country's goods imports, according to Department of Customs data.
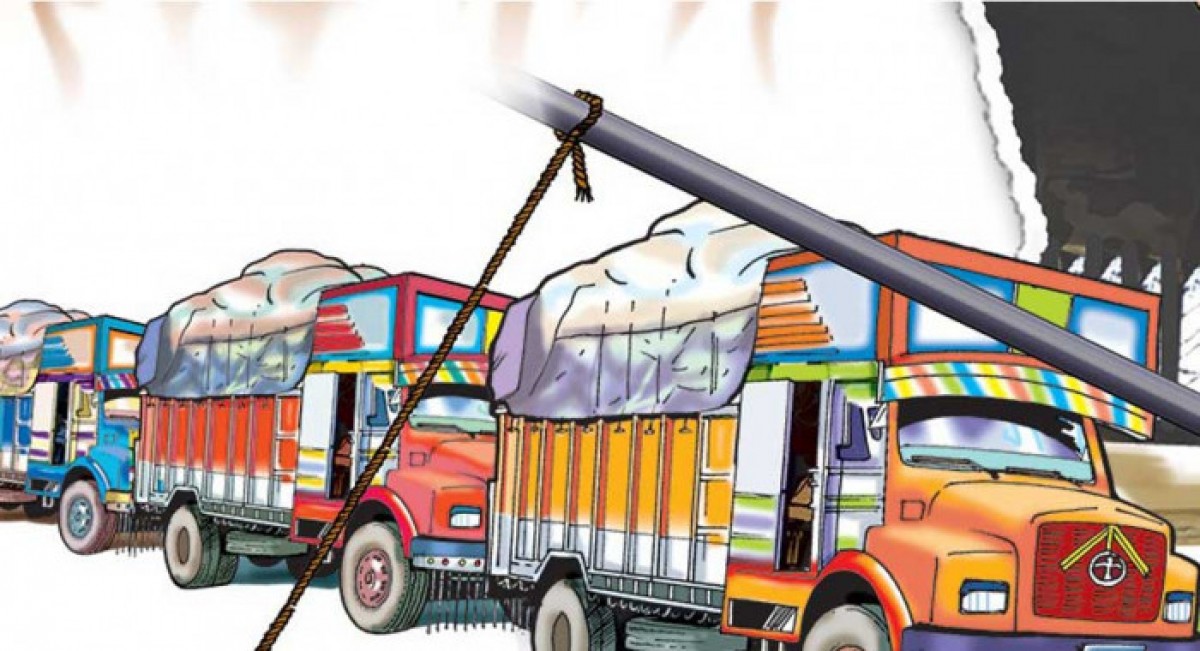
KATHMANDU: Nepal’s trade deficit widened to Rs 1.78 trillion in FY 2025/26 as a 16.20% surge in imports outpaced 13.81% export growth, pushing total trade past Rs 2.41 trillion. Nepal imports Rs 6.65 worth of goods for every rupee exported.
Neighbors India and China supply nearly 78% of imports, while India absorbs over 82% of exports. Top exports, such as processed soybean oil, rely heavily on imported raw materials, exposing a narrow domestic manufacturing base and deep structural trade vulnerabilities.
What do the newest customs figures show about Nepal’s overall trade position for fiscal year 2025/26?
According to the Department of Customs, Nepal’s total foreign trade for fiscal year 2025/26, covering mid-July 2025 through mid-July 2026, reached approximately Rs 2.41 trillion, made up of imports worth roughly Rs 2.096 trillion and exports worth about Rs 315.29 billion. The resulting trade deficit stood at approximately Rs 1.78 trillion, an increase of 16.63 percent over the deficit recorded in fiscal year 2024/25.

Department of Customs. File photo
Imports grew by 16.20 percent year on year while exports grew by 13.81 percent, meaning that although Nepal did register meaningful export growth in absolute terms, the pace of import growth outpaced it comfortably enough that the overall gap between the two widened rather than narrowed compared with the previous year.
This is not an isolated shock but part of a multi-year pattern in which Nepal’s economy consistently imports far more than it manages to sell abroad.
How lopsided is the ratio between imports and exports, and is it improving or worsening?
For every one rupee of goods Nepal exported in fiscal year 2025/26, it imported roughly Rs 6.65 worth of goods, up from a ratio of about Rs 6.51 in fiscal year 2024/25. Exports’ share of Nepal’s total foreign trade slipped from around 13.31 percent to about 13.07 percent over the same period, while imports’ share rose correspondingly from roughly 86.69 percent to about 86.93 percent.
These year-on-year movements are not dramatic in isolation, but the direction has held consistently for several years running: Nepal’s overall trade structure keeps tilting further toward imports rather than becoming more balanced, despite a series of government strategies explicitly aimed at boosting exports over the past decade.
Which single country supplies the largest share of Nepal’s imports?
India remains by a wide margin Nepal’s largest import source, supplying goods worth approximately Rs 1.21 trillion in fiscal year 2025/26, or close to fifty-eight percent of Nepal’s entire import bill. This overwhelming dominance reflects Nepal’s open border with India, lower transport costs compared with distant suppliers, and decades of integrated supply chains covering everything from fuel and construction materials to consumer goods, vehicles and industrial inputs.
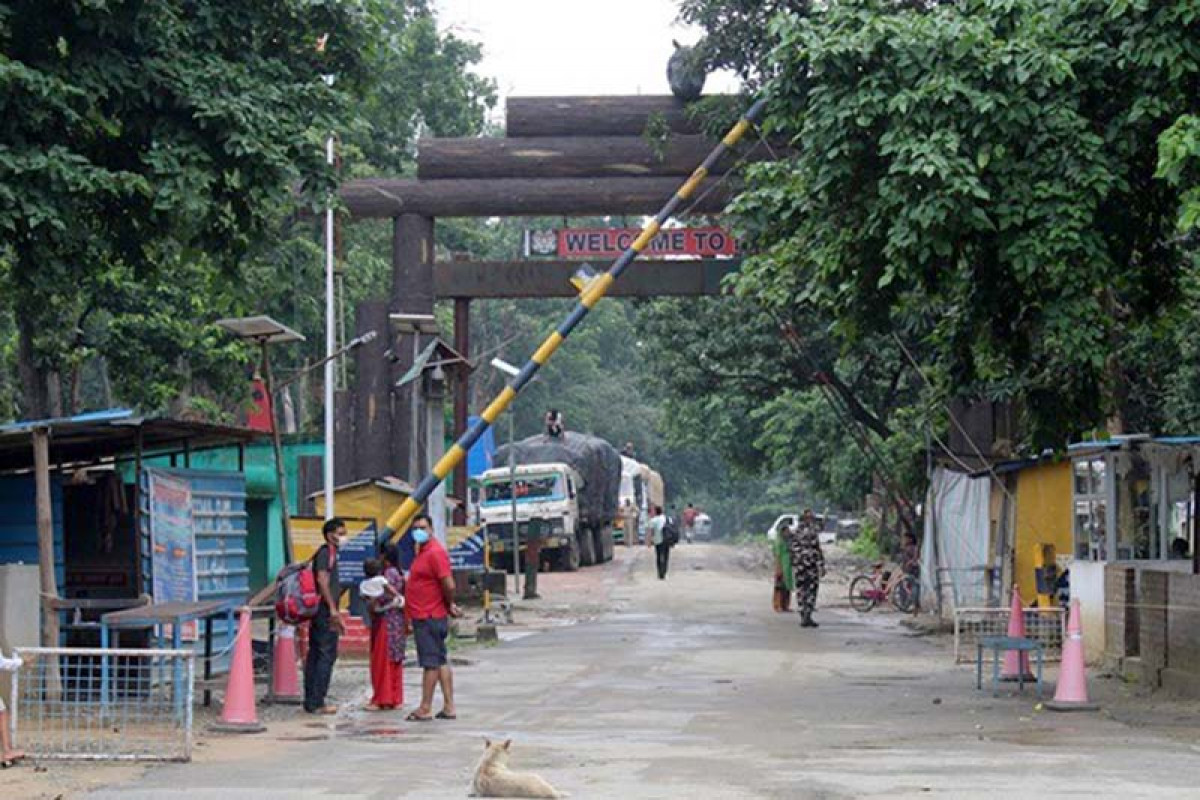
Nepal-India border crossing in Bara district. File photo
No other trading partner comes remotely close to India’s share of Nepal’s imports, underscoring how dependent the country’s entire import architecture is on a single neighboring economy for the large majority of what Nepali households and industries consume and build with on a daily basis.
What role does China play in Nepal’s import structure?
China ranks as Nepal’s second-largest import source, supplying goods worth approximately Rs 425.24 billion in fiscal year 2025/26, or close to twenty percent of total imports. Combined, India and China together account for more than Rs 1.63 trillion of Nepal’s total imports, roughly seventy-eight percent of the overall import bill, which means fewer than a quarter of Nepal’s import needs are met by the entire rest of the world put together.

Freight truck crosses the Rasuwagadhi border point connecting Nepal and China. China ranks as Nepal’s second-largest import source, supplying goods worth approximately Rs 425.24 billion in fiscal year 2025/26. File photo
This heavy concentration in two immediate neighbors, one of which effectively controls Nepal’s only practical land access to the sea, leaves the country’s supply chains structurally exposed to any disruption in either bilateral relationship, a vulnerability Nepal has experienced directly in the past.
Which other countries feature prominently among Nepal’s import sources?
After India and China, Argentina ranks third among Nepal’s import sources, supplying goods worth approximately Rs 116.38 billion in fiscal year 2025/26, driven almost entirely by crude soybean oil used as raw material in Nepal’s domestic edible oil processing industry.
The United Arab Emirates follows at roughly Rs 52.16 billion, then the United States at about Rs 32.71 billion, Indonesia at approximately Rs 22.18 billion, Australia at around Rs 20.39 billion, Thailand at roughly Rs 18.36 billion, Brazil at about Rs 17.76 billion, and Malaysia at approximately Rs 15.50 billion.
This list reflects a mix of energy suppliers, agricultural commodity exporters feeding Nepal’s processing industries, and a small number of manufactured-goods suppliers, none of which approaches the scale of India or China.
Why does Argentina rank so high among Nepal’s import partners despite having no obvious geographic or historical trade connection?
Argentina’s prominent position is explained almost entirely by one commodity: crude soybean oil. Nepal’s domestic vegetable oil processing industry, which refines imported crude oil and then re-exports a significant share of the finished product, mainly to India, relies on Argentina as a major source of that raw material because of its scale as a global soybean oil exporter.

Central Bank of Argentina. File photo
This single-commodity dependency also explains the striking imbalance within the Nepal-Argentina trade relationship specifically, where Nepal imported goods worth roughly Rs 116.38 billion in the year but exported back only about Rs 18,000 worth in return, making it, in relative terms, one of the most one-sided bilateral trade relationships Nepal maintains with any country in the world.
How concentrated are Nepal’s exports by destination market?
Nepal’s export side is, if anything, even more concentrated than its import side. More than eighty-two percent of total exports, worth approximately Rs 258.65 billion, went to India alone in fiscal year 2025/26.
This heavy concentration reflects both the open-border trading relationship and the fact that several of Nepal’s largest export items by value, particularly processed soybean oil, function essentially as re-exports feeding directly into the Indian market rather than representing genuinely diversified Nepali manufacturing output built for multiple international buyers around the world.
Beyond India, which markets matter most for Nepal’s exports?
The United States ranks as Nepal’s second-largest export destination, absorbing goods worth approximately Rs 20.77 billion in fiscal year 2025/26, followed by Germany at about Rs 4.98 billion, the United Kingdom at roughly Rs 3.22 billion, Japan at approximately Rs 2.30 billion, France at about Rs 2.21 billion, and Australia at roughly Rs 2.12 billion.
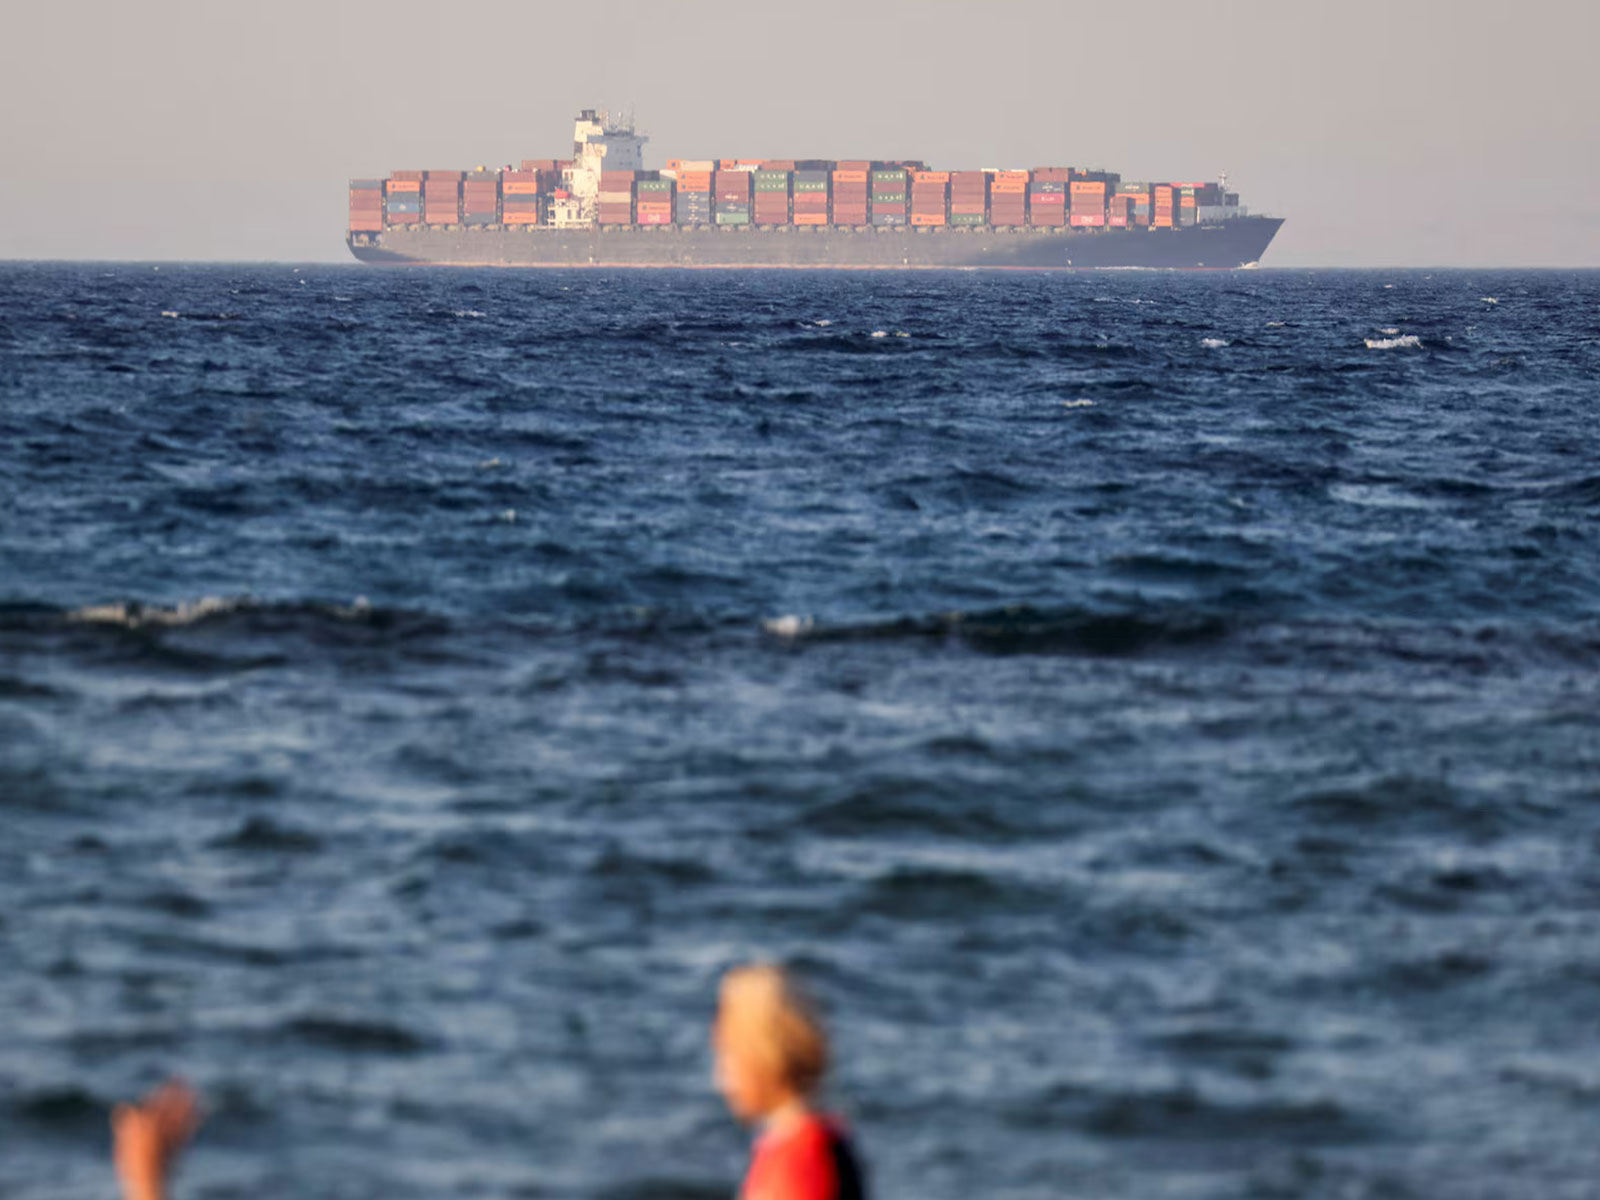
A cargo vessel navigates United States waters. The U.S. ranks among Nepal’s top trade partners, exporting goods worth roughly Rs 32.71 billion to Nepal in fiscal year 2025/26. File photo
Notably, China ranks far down the export destination list, receiving goods worth only about Rs 1.89 billion from Nepal, a figure dwarfed by the roughly Rs 425.24 billion Nepal imports from China in the same year, which illustrates just how one-directional the overall Nepal-China trade relationship remains.
Other markets including the United Arab Emirates, Italy, Canada, the Netherlands, Turkey, Singapore and Denmark each absorbed goods worth between approximately Rs 1 billion and Rs 2 billion.
What are Nepal’s leading export commodities by value?
Processed soybean oil stands as Nepal’s single largest export item, accounting for roughly forty-one percent of total export value at approximately Rs 128.74 billion, almost entirely destined for India and dependent on imported Argentine and Brazilian crude oil as feedstock.
This is followed by large cardamom at approximately Rs 12.64 billion, processed sunflower oil at roughly Rs 8.94 billion, jute fabric at about Rs 7.14 billion, and woolen carpets at approximately Rs 6.73 billion, whose primary destination market remains the United States.
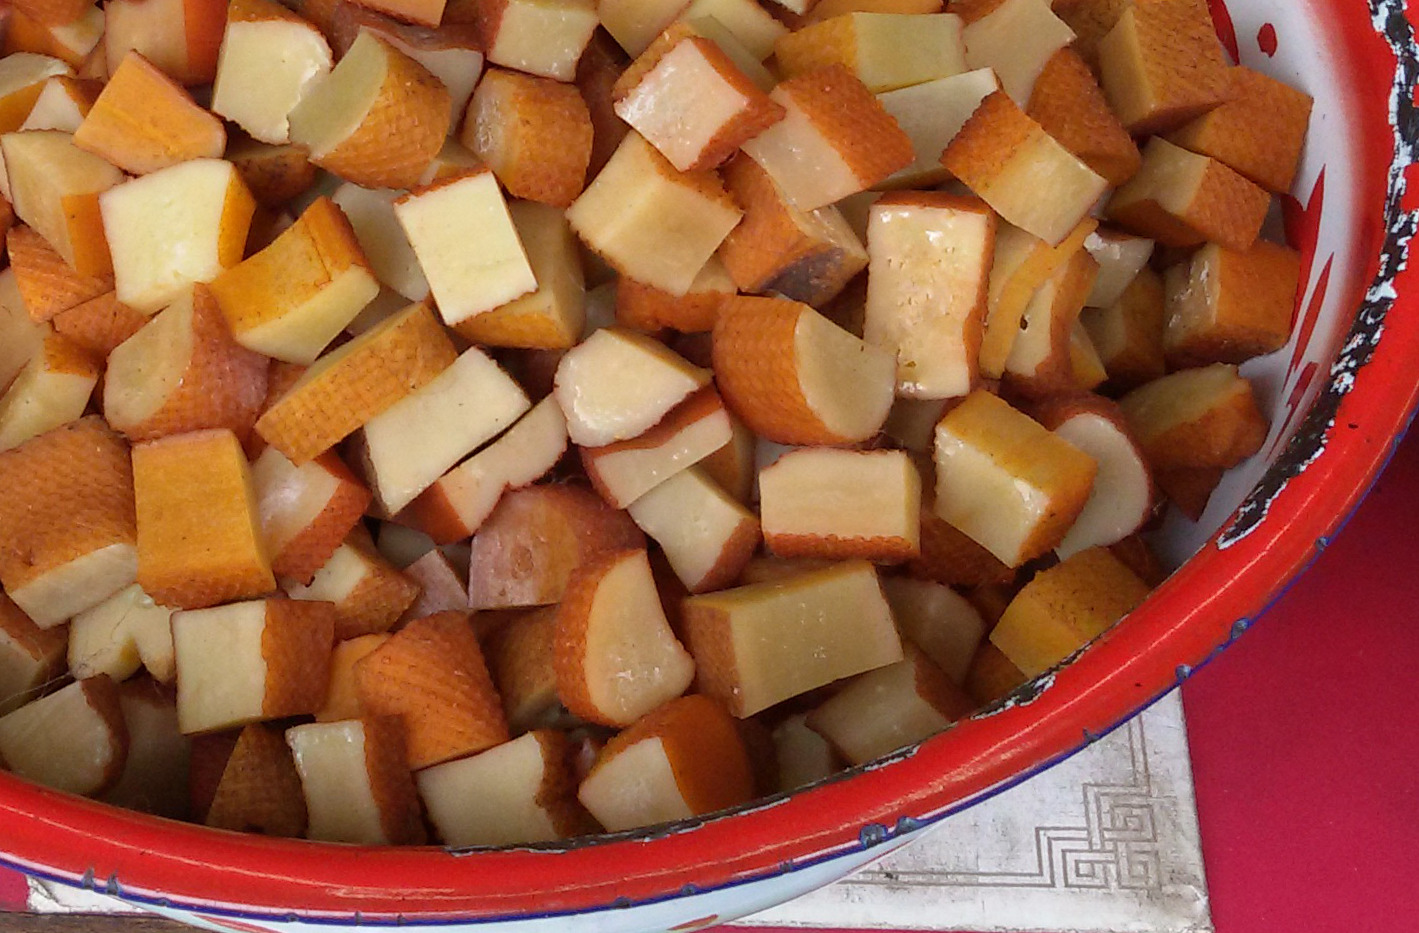
Commercialized globally as organic dog chews, the traditional Himalayan dairy product (chhurpi) brought in roughly Rs 4.19 billion in fiscal year 2025/26. File photo
Other notable export items include processed palm oil at roughly Rs 6.67 billion, two categories of polyester yarn together worth close to Rs 9.90 billion, fruit juice at about Rs 4.74 billion, and dog chew, the pet-food product made from chhurpi (Himalayan cheese), at approximately Rs 4.19 billion.
What does this list of top export commodities suggest about the underlying structure of Nepal’s export economy?
A significant share of Nepal’s highest-value exports are processed edible oils that depend almost entirely on imported raw material, meaning Nepal is effectively adding a fairly thin layer of processing margin to commodities it does not grow domestically before selling the finished product on, largely to one neighboring market.
Export items that are more genuinely Nepal-origin and value-added, such as large cardamom, woolen carpets and chhurpi, appear further down the value ranking despite representing more authentic domestic production, employment and rural income generation.
This composition helps explain why Nepal’s export growth can look reasonably healthy in aggregate rupee terms even while the underlying manufacturing and agro-processing base supporting that growth remains fairly narrow and heavily concentrated in a small number of commodities and destinations.
What are the largest categories on the import side?
Diesel stands as Nepal’s single largest import item, worth approximately Rs 172.43 billion in fiscal year 2025/26, with more than 1.39 million kiloliters entering the country over the year, reflecting Nepal’s near-total dependence on imported petroleum for transport and backup power generation.

Diesel stands as Nepal’s single largest import commodity, valued at approximately Rs 172.43 billion in fiscal year 2025/26. File photo
Crude soybean oil ranks second at approximately Rs 132.77 billion, feeding the domestic refining and re-export industry described earlier, followed by petrol at roughly Rs 77.26 billion, cooking gas at about Rs 60.28 billion, iron and steel raw material at approximately Rs 58.52 billion, and smartphones at roughly Rs 48.69 billion, with more than 2.26 million handsets entering the country during the year.
Other significant import categories include retail-ready medicine worth approximately Rs 29.15 billion, hot-rolled iron and steel sheets, gold worth roughly Rs 26.78 billion, aviation fuel, DAP fertilizer, coal, chemical fertilizer, crude sunflower oil and silver, each running between roughly Rs 21 billion and Rs 27 billion.
With how many countries does Nepal run a trade deficit, and how many does it run a surplus with?
Out of a total of 162 countries with which Nepal recorded any trade activity in fiscal year 2025/26, it ran a deficit with 134 of them and a surplus with only 28.
This lopsided count shows that Nepal’s overall import dependence is not simply an India-China story, since the deficit pattern extends across the vast majority of Nepal’s trading relationships worldwide, including countries with which Nepal has comparatively little historical or geographic connection.
Which countries does Nepal actually run a trade surplus with, and why?
Nepal’s trade surplus partners are mostly small European countries and island nations where Nepal imports very little or nothing at all, meaning that even modest export activity automatically produces a surplus.
Denmark tops this list, with Nepal exporting goods worth approximately Rs 1.02 billion against imports of only about Rs 21.62 million, a net surplus of roughly Rs 804.5 million. Norway and Romania follow with smaller surpluses of about Rs 88 million and Rs 42.2 million respectively, and Iceland records a surplus of around Rs 26 million.

Department of Customs. File photo
A number of countries, including Grenada, Fiji, the Bahamas, Barbados, Syria and Angola, recorded zero recorded imports from Nepal during the year, meaning any Nepali export to them automatically counts as a full surplus, though the absolute values involved in these cases are negligible in the context of Nepal’s overall trade.
What does customs-office-level data reveal about how Nepal’s trade physically enters and leaves the country?
Nearly forty-seven percent of Nepal’s total import value, approximately Rs 986.43 billion, passed through the Birgunj customs point alone in fiscal year 2025/26, making it by far the country’s busiest port of entry, followed by Bhairahawa at approximately 14.51 percent of import value, Biratnagar at about 11.54 percent, and Tribhuvan International Airport handling close to 9.71 percent.
On the export side the pattern shifts somewhat: Birgunj still leads at roughly 36.43 percent of export value, but Biratnagar’s export share, at over 28 percent, is proportionally far larger than its import share, suggesting the eastern Terai corridor plays an outsized role in moving Nepali-made goods, including tea, jute products and chhurpi from the eastern hill districts, toward international markets.

Birgunj Customs Office. File photo
Tribhuvan International Airport likewise carries a noticeably larger share of exports, around 12 percent, than its import share, consistent with the airfreight-dependent nature of higher-value or time-sensitive export items such as carpets and processed agricultural goods.
What does the import duty structure reveal about how Nepal’s tariff system is organized?
Customs data on import duty rates for fiscal year 2025/26 shows that goods facing a 10 percent tariff slab accounted for the largest share of Nepal’s total import value, at approximately 29.56 percent, followed by the 5 percent slab at roughly 20.21 percent and the 15 percent slab at close to 12.49 percent.
In terms of actual duty revenue collected, however, the picture shifts: the 30 percent tariff bracket generated the largest single share of total import duty, at nearly 19.94 percent, despite covering a much smaller share of overall import value, at only about 6.69 percent.
This gap between value share and revenue share shows that Nepal’s tariff structure places its heaviest revenue burden on a relatively narrow band of higher-duty goods, typically finished consumer products, while bulk raw materials, fuel and industrial inputs, which make up the bulk of import value, are taxed at comparatively lower rates to keep production costs manageable for domestic industry.