Kathmandu
Sunday, July 12, 2026





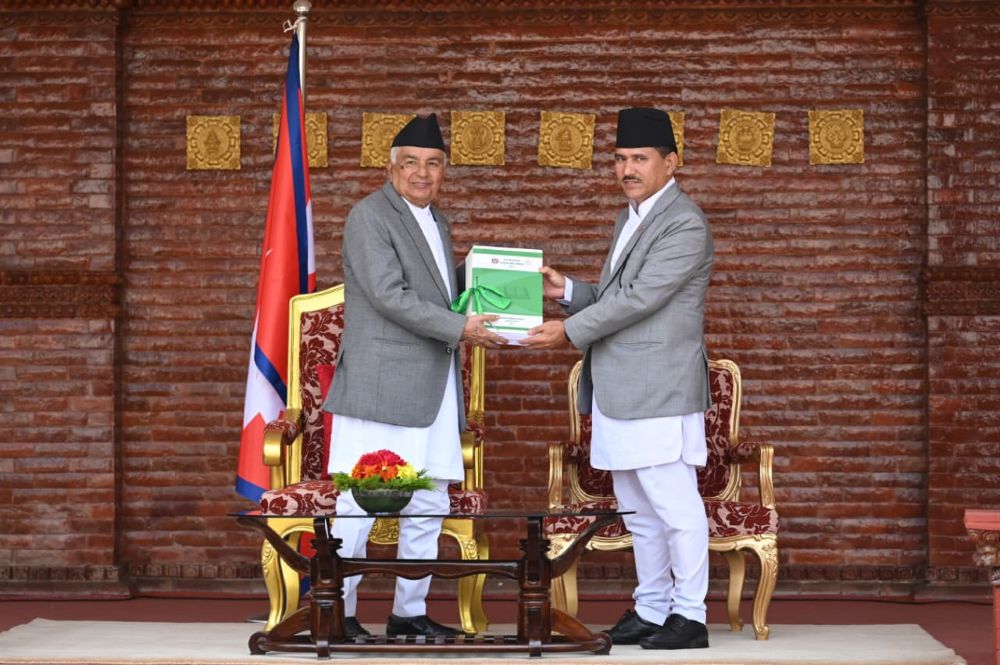
KATHMANDU: The Office of the Auditor General of Nepal, under Auditor General Toyam Raya, is constitutionally mandated under Article 241 to audit all federal, provincial, and local government offices for regularity, economy, efficiency, effectiveness, and propriety.
The 63rd Annual Report covers fiscal year 2024/25 and was prepared under Section 19(1) of the Audit Act, 2019. This year’s audit covered 5,526 entities with total transactions of approximately Rs 9.484 trillion. Beyond financial audits, 15 performance audits, one environmental audit, and one special audit were conducted.
The report flags both tangible financial irregularities and systemic, policy-level weaknesses requiring reform.
What is this report, who prepared it, and what does it cover?
This is the 63rd Annual Report of the Auditor General of Nepal, prepared by Auditor General Toyam Raya and submitted to President Ram Chandra Paudel as required under Article 294(1) of the Constitution and Section 19(1) of the Audit Act, 2019.
The report covers fiscal year 2024/25 and encompasses audits of federal ministries and bodies, all seven provincial governments, 721 local governments, organized institutions, committees, and other entities mandated by federal law.
Beyond this summary report, separate annual reports were prepared for each of the seven provinces under Article 294(3) of the Constitution. Audit opinions with recommendations were issued for all audited entities.
The report also includes 15 performance audits, one environmental audit on national park management and buffer zone impacts, and one special audit on public procurement and arbitration. The audit process was managed through the Nepal Audit Management System, which has been in use since fiscal year 2020/21.
How many entities were audited and how much money was examined this year?
A total of 5,526 entities were audited, with financial transactions totalling approximately Rs 9.484 trillion examined. Breaking this down, 3,050 federal ministry entities including two backlog cases had transactions of approximately Rs 2.918 trillion audited, while 1,124 provincial ministry entities including two backlog cases had transactions of approximately Rs 320.30 billion audited.
For local governments, 721 units covering 4 metropolitan cities, 10 sub-metropolitan cities, 261 municipalities, and 446 rural municipalities had transactions of approximately Rs 1.109 trillion audited. Additionally, 577 committees and other institutions including 133 at the provincial level had transactions of approximately Rs 447.77 billion audited.
A total of 44 organized and federally designated institutions covering 54 fiscal years had transactions of approximately Rs 4.689 trillion audited, of which 6 institutions covering 7 fiscal years amounted to Rs 956.54 billion. Beyond financial audits, 15 performance audits, one environmental audit, and one special audit were completed.
Why were some entities left unaudited this year, and how much was missed?
This is one of the most unusual findings in recent audit history. Due to Gen Z protests and incidents that occurred on September 8 and 9, 2025, a total of 179 offices and bodies failed to submit their accounts and related records to the Auditor General’s office. As a direct result, transactions worth approximately Rs 147.89 billion could not be audited this year. This is a significant gap in public financial oversight.
The report records this as a factual limitation resulting from the political situation at the time rather than from administrative negligence by the audit office itself. The nature of the protests and how they specifically prevented record submission is noted as the cause, but the report makes clear that the gap in audit coverage is substantial and that those 179 entities remain outside the audit perimeter for the 2024/25 fiscal year.
What is the total financial irregularity identified this year, and how is it classified?
The total financial irregularities identified across federal government offices, provincial offices, local governments, committees, and other institutions through this year’s audit amount to Rs 88.09 billion. This figure remained after Rs 7.18 billion was cleared through the review process following the preliminary audit report.
Of the total irregularity amount, 37.06 percent or Rs 32.65 billion falls under the category that must be recovered outright, covering misappropriation, losses, and other recoverable amounts. Another 57.06 percent or Rs 50.27 billion requires regularisation, of which the largest sub-category is transactions where supporting documents were not submitted, accounting for 41.19 percent of total irregularities.
Transactions recorded in an irregular manner accounted for 15.71 percent. The remaining 5.88 percent or approximately Rs 5.17 billion consists of outstanding advance payments.
Federal government offices account for Rs 53.49 billion of the total, with the Finance Ministry alone contributing 70.36 percent of all federal irregularities.
What is the total cumulative outstanding irregularity across all years, and how has it changed?
The cumulative outstanding irregularity across all government levels as of this report stands at Rs 755.17 billion, representing an increase of 2.99 percent compared to the previous year’s figure of Rs 733.19 billion.
This cumulative figure is arrived at by taking the prior year’s outstanding balance of Rs 733.19 billion, subtracting adjustments of Rs 2.98 billion and settlements of Rs 63.13 billion during the year, leaving a net prior-year balance of Rs 667.08 billion, to which this year’s fresh irregularities of Rs 88.09 billion were added.
Federal government offices account for the largest share at Rs 378.54 billion of the cumulative total. Local governments account for Rs 220.47 billion, committees and other institutions account for Rs 122.19 billion, and provincial offices account for Rs 33.97 billion.
The total amount requiring timely resolution, including audit backlogs, revenue arrears, unreturned foreign grants and loans, and overdue guaranteed loan amounts, has grown by Rs 236.84 billion this year to reach Rs 787.86 billion.
How was the federal government budget spent this year, and which sectors performed best and worst?
According to data from the Financial Comptroller General’s Office, the federal government’s initial budget for fiscal year 2024/25 was approximately Rs 1.860 trillion, of which approximately Rs 1.513 trillion was actually spent, giving an overall expenditure rate of 81.34 percent.

Financial Comptroller General’s Office
Recurrent expenditure reached 82.98 percent of its estimate, while capital expenditure stood at only 63.57 percent, continuing the long-running pattern of capital underspending. Financial management expenditure reached 90.58 percent.
Among sectoral spending, economic affairs exceeded its allocation significantly at 146.54 percent. Defence reached 104.38 percent and health reached 100.43 percent. At the other end, environmental protection spent only 35.94 percent of its allocation, general public services spent 50.38 percent, and housing and community facilities reached 57.04 percent.
Capital spending was heavily skewed toward the final quarter, with only 13, 12, 21, and 54 percent spent in the first, second, third, and fourth quarters respectively.
How does Nepal’s economic performance compare to the 16th Plan targets?
According to data from the Finance Ministry cited in the report, Nepal’s performance against the 16th Periodic Plan targets for fiscal year 2024/25 fell short across most indicators.
The plan targeted economic growth of 7.5 percent while actual growth reached only 4.61 percent. Capital expenditure as a share of GDP was targeted at 6.20 percent but reached only 3.67 percent.

Ministry of Finance
Revenue collection as a share of GDP was targeted at 20.62 percent but reached only 19.30 percent. Total government expenditure as a share of GDP was 24.78 percent against a target of 28.20 percent. Consumer price inflation came in at 4.06 percent, below the plan target of 6 percent.
Imports grew by 13.25 percent compared to the previous year, pushing the trade deficit to 25 percent of GDP and reaching approximately Rs 1.527 trillion. Foreign aid receipts reached only 71.20 percent of target.
Revenue collection achieved only 84.28 percent of the annual target. The report notes that achieving the 16th Plan’s terminal year GDP target of Rs 8.019 trillion requires annual growth of 7.1 percent, making the current trajectory deeply concerning.
What is the status of Nepal’s public debt, and what new concerns emerged this year?
According to the Annual Debt Report 2024/25 cited in the report, Nepal’s total public debt by mid-July 2025 reached approximately Rs 2.674 trillion. External debt stood at approximately Rs 1.406 trillion, representing 52.57 percent of the total, while domestic debt stood at approximately Rs 1.268 trillion, making up 47.43 percent.
As a share of GDP, public debt rose from 42.67 percent the previous year to 43.79 percent this year, continuing an upward trend from 39.92 percent in 2020/21. The report raises a specific concern that exchange rate movements alone added Rs 65.54 billion in additional debt liability this year, demonstrating the sensitivity of Nepal’s debt structure to external monetary factors.
The report recommends that debt be deployed in productive sectors that generate returns and that financial instruments to manage foreign exchange risk be explored, noting that public debt as a share of GDP has now reached its highest level in the five-year period presented.
How did revenue collection perform, and what are the key problems identified?
According to data from the Financial Comptroller General’s Office, federal government revenue collection in fiscal year 2024/25 reached approximately Rs 1.052 trillion against a target of approximately Rs 1.260 trillion, giving a collection rate of 83.50 percent.
Tax revenue reached only 80.94 percent of its target at approximately Rs 910.73 billion. Non-tax and other receipts exceeded their target at 102.93 percent. Compared to the previous year, overall revenue grew by 9.61 percent. The report identifies several structural problems.
Customs revenue reached only 75.12 percent of its target. Tax arrears grew by 8.27 percent from the previous year to approximately Rs 275.05 billion including interest, of which 65.48 percent or Rs 180.10 billion is under judicial review.
Overdue principal on loans made to public institutions, committees, boards, funds, and local governments grew by a dramatic 262.82 percent compared to the previous year, reaching Rs 259.20 billion, which is 49.27 percent of total loan investment. Revenue waivers and exemptions are also identified as a growing concern affecting revenue mobilisation.
How much foreign aid did Nepal actually receive compared to projections this year?
According to the consolidated financial statements from the Financial Comptroller General’s Office cited in the report, foreign grants were projected at approximately Rs 52.33 billion and foreign loans at approximately Rs 217.67 billion for fiscal year 2024/25, giving a combined projection of approximately Rs 270 billion.
Excluding technical assistance, actual foreign grant receipts came in at approximately Rs 29.65 billion, which is 56.67 percent of the projection. Actual foreign loan receipts reached approximately Rs 126.95 billion, which is 58.32 percent of the projection. Combined, foreign aid reached only approximately Rs 156.60 billion, well below the combined estimate.
Total expenditure financed from Nepal government’s own sources rose by 8.62 percent compared to the prior year, while foreign grant-financed spending grew by 16.70 percent and foreign loan-financed spending grew by 6.83 percent. The persistent gap between foreign aid commitments and actual disbursements continues to strain capital programme execution.
What is the state of the Federal Consolidated Fund’s cash position?
The Federal Consolidated Fund’s financial statements for 2024/25 show that total receipts including revenue, grants, domestic and external loans, prior year cash balances, and other adjustments amounted to approximately Rs 1.541 trillion.
Against this, total expenditure including recurrent, capital, and financial management stood at approximately Rs 1.513 trillion, leaving a positive balance of approximately Rs 27.99 billion for the year. However, when the cumulative negative balance carried forward from previous years of approximately Rs 228.36 billion is adjusted, the net cumulative deficit of the Federal Consolidated Fund reaches approximately Rs 200.36 billion.
Furthermore, other government funds and accounts held a negative balance of approximately Rs 172.05 billion at year end, meaning the government’s overall cash and bank position after all adjustments was negative by approximately Rs 28.30 billion.
The Nepal Rastra Bank’s own financial statements show the Consolidated Fund balance at negative Rs 69.86 billion, which is Rs 41.55 billion more negative than what the government’s own financial statements show, pointing to a reconciliation gap between the two sets of records.
How many offices were free of significant irregularities, and what patterns emerge from local government audits?
Out of 3,050 federal government offices audited this year, 894 offices, which is 29.31 percent of the total, were found without significant financial irregularities. For provincial government offices, 328 out of 1,124 offices audited, or 29.18 percent, were similarly found without significant irregularities.
Among local governments, the distribution shows that 681 local governments had irregularity rates below 5 percent of their audited transaction amount, while 39 had rates between 5 and 15 percent, and only one local government exceeded 15 percent. Across all federal and provincial offices, local governments, and committees including backlog cases, a total of 187,914 individual instances of irregularity were identified during the year.
Of these, 94,438 were theoretical or procedural, while 93,476 were tangible financial irregularities with direct monetary implications. The combined irregularity rate for provincial offices was 1.63 percent of audited amounts, and for local governments it was 1.72 percent.
Among provinces, Madhesh Province had the highest irregularity rate at 3.77 percent while Bagmati Province had the lowest at 0.83 percent.
How much was recovered during this audit cycle, and what does the recovery picture look like?
During this year’s audit process, recoveries and settlements occurred at multiple stages. During the audit itself, Rs 576.89 million was recovered. After the preliminary audit reports were issued, a further Rs 904.78 million was recovered.
From prior years’ outstanding cumulative irregularities, Rs 13.15 billion was recovered during settlement reviews. In total, Rs 14.63 billion was recovered and settled across all levels of government during this audit cycle.
Federal government offices accounted for Rs 12.03 billion of this total, local governments for Rs 1.82 billion, committees and other institutions for Rs 551.43 million, and provincial offices for Rs 234.88 million.
For local governments specifically, 491 local governments recovered Rs 321.90 million during the audit process itself, and 502 local governments recovered Rs 479.63 million after the preliminary report was issued, with a further Rs 101.87 million recovered from prior year irregularity settlements, bringing the local government total for the year to Rs 1.82 billion.
What were the major findings on national priority projects, infrastructure, and public services?
The report identifies serious concerns across multiple priority sectors. On National Pride Projects, of the 27 projects declared nationally significant, only 3 have been completed, while 9 have less than 50 percent physical progress and 2 have not even started, including the West Seti Hydropower Project and the Nijgadh International Airport. The Kathmandu-Terai Expressway has reached only 42.13 percent progress.
On infrastructure, 782 construction contracts under Physical Infrastructure, Energy, and Urban Development ministries worth approximately Rs 47.73 billion remain incomplete despite receiving partial payments. Price adjustment overpayments of approximately Rs 370.67 million were identified across 144 contracts.
On health services, medical equipment worth hundreds of millions of rupees remains unused across multiple hospitals including the National Trauma Centre, Bir Hospital, BP Koirala Memorial Cancer Hospital, and Nepal Police Hospital.
Medicines worth approximately Rs 90.72 million had expired at several health institutions. Nepal Airlines Corporation’s outstanding loan repayments to the Employees Provident Fund and Citizens Investment Trust combined stand at approximately Rs 5.50 billion.

Nepal Airlines Corporation’s central office located at New Road, Kathmandu. Photo: Bikram Rai
What are the key reforms recommended for the future?
The report’s Chapter 5 presents reforms under eight broad areas. On governance and law, it calls for enacting fundamental laws related to federalism including civil service laws, resolving contradictions in existing laws, and updating procurement law for goods and services including IT, medicines, and heritage reconstruction.
On federal coordination, it recommends institutionalising inter-governmental mechanisms, removing duplication in taxation, and making financial transfers predictable.
On public financial management, it calls for realistic budget formulation based on actual spending capacity, strict control on unproductive expenditure, a clear policy on public debt deployment only in productive and capital-forming sectors, and bringing all foreign aid into the national budget system.
On development management, it urges project selection based on genuine cost-benefit analysis, ending the practice of starting projects without completed feasibility studies and land acquisition, and reforming public procurement to prevent contract splitting, inflated variation orders, and repeated deadline extensions.
On accountability, it calls for linking irregularity resolution to civil servants’ performance appraisals and career advancement, strengthening internal audit before external audit, and making all public official allowances and benefits fully transparent.