Kathmandu
Monday, July 6, 2026





The National Statistics Office's latest report reveals slower economic growth, rising remittance dependence, a widening resource gap, changing sectoral trends and sharp provincial disparities. Here's what the numbers mean
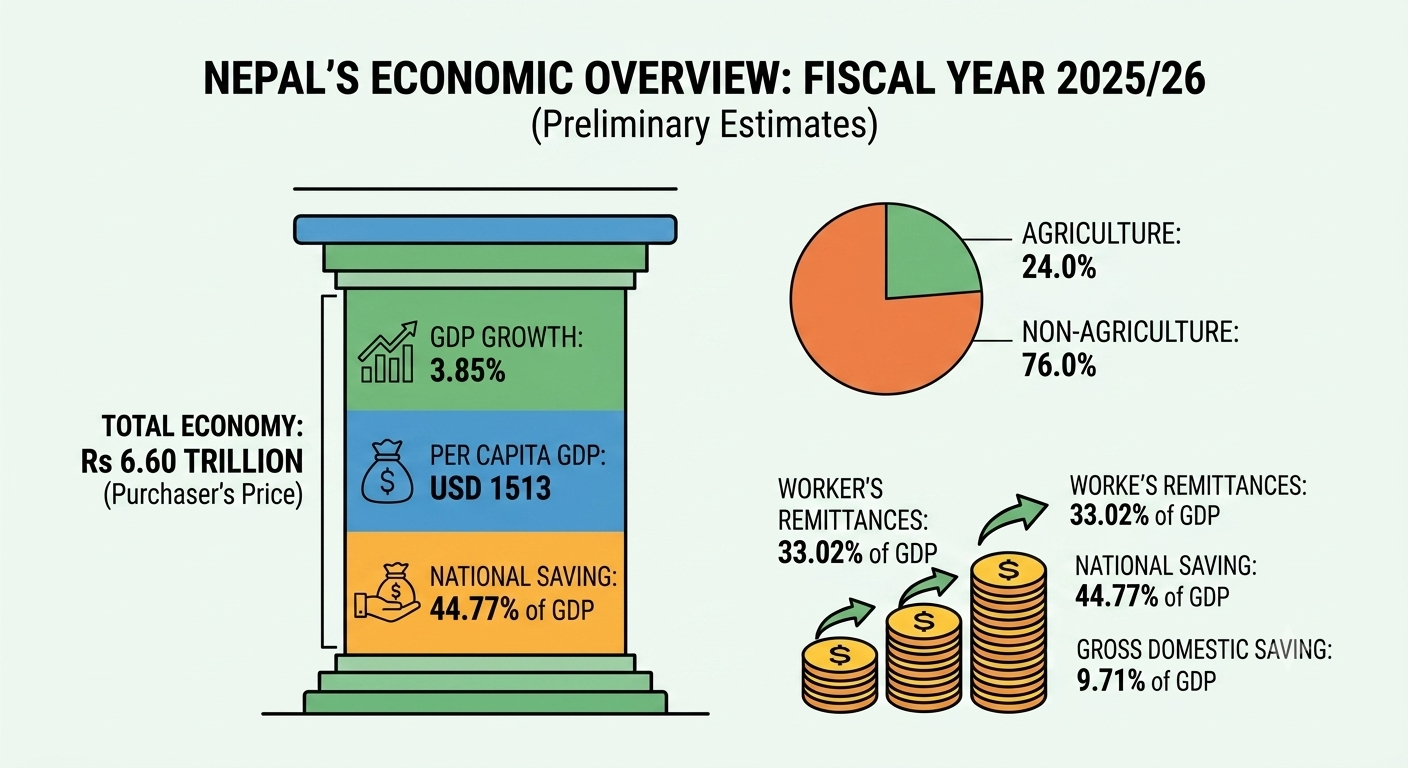
KATHMANDU: Nepal’s economy grew by 3.85 percent in fiscal year 2025/26, according to preliminary estimates released by the National Statistics Office (NSO) under the Office of the Prime Minister and Council of Ministers.
This is lower than the revised growth rate of 4.43 percent recorded in 2024/25, though higher than the finalized 3.68 percent for 2023/24.
Nominal GDP at purchaser’s price stood at Rs 6.60 trillion, with nominal per capita GDP at USD 1513.
The report also flags a widening resource gap and rising reliance on remittances, alongside sector-wise, expenditure-wise, income-wise, quarterly, and provincial breakdowns of the economy.
What is the overall size of Nepal’s economy in fiscal year 2025/26, and how has it changed from previous years?
Nepal’s Gross Domestic Product (GDP) at purchaser’s price is estimated at Rs 6.60 trillion in 2025/26, up from Rs 6.20 trillion in 2024/25 and Rs 5.76 trillion in 2023/24.
Measured at basic price, GDP stands at Rs 5.80 trillion in 2025/26, compared to Rs 5.45 trillion the previous year. These figures represent the preliminary estimate for the current fiscal year, based on data available for roughly the first six to eight months supplemented by standard estimation procedures for the remaining months. The NSO follows a three-year cycle in which the current year is preliminary, the prior year is revised, and the year before that is finalized.
So 2025/26 figures are preliminary, 2024/25 figures are revised, and 2023/24 figures are considered final. The steady rise in nominal GDP reflects both real growth in output and the effect of price increases, since these are current price, not inflation-adjusted, figures.
What is Nepal’s GDP growth rate for 2025/26 and how does it compare with recent years?
The annual growth rate of GDP at purchaser’s price is estimated at 3.85 percent for 2025/26, a slowdown from the revised 4.43 percent recorded for 2024/25, though still above the finalized 3.68 percent for 2023/24.
At basic price, the growth rate is estimated at 3.68 percent for 2025/26, compared with a revised 3.80 percent for 2024/25 and a finalized 3.38 percent for 2023/24. The slower pace of growth in the current fiscal year suggests some deceleration in economic momentum compared to the previous year, even though it remains higher than two years ago.
Nepal’s economic growth has fluctuated in this range for several years, shaped by seasonal factors such as monsoon-dependent agriculture, external demand for exports, remittance-driven consumption, and government spending patterns.
The gap between purchaser’s price and basic price growth rates reflects the impact of net taxes on products, which are added to basic price GDP to arrive at purchaser’s price GDP.
How did the primary, secondary, and tertiary sectors perform in terms of Gross Value Added growth?
The Gross Value Added (GVA) growth rates for 2025/26 are estimated at 1.63 percent for the primary sector, 5.77 percent for the secondary sector, and 4.21 percent for the tertiary sector. This marks a notable slowdown in the primary sector compared to 2024/25, when it grew a revised 3.05 percent, while the secondary sector accelerated from a revised 4.36 percent and the tertiary sector grew slightly faster than the previous year’s 4.49 percent.
The primary sector includes agriculture, forestry, and fishing. The secondary sector covers manufacturing, mining, construction, electricity, gas, and water supply. The tertiary sector comprises services such as trade, transport, communication, finance, real estate, education, and public administration.
The uneven performance across these broad categories, with the primary sector nearly stagnant while secondary and tertiary sectors expanded more strongly, illustrates a structural shift within the economy toward industry and services and away from agricultural output as the main driver of growth.
What is the sectoral composition of Nepal’s GDP, and how has the balance between agriculture and non-agriculture shifted?
Agriculture’s share in GDP is estimated at 24.0 percent in 2025/26, down slightly from 24.5 percent in 2024/25, while the non-agriculture sector’s share rose to 76.0 percent from 75.5 percent.
In terms of the three broad economic sectors, the primary sector’s share stands at 24.5 percent in 2025/26 compared to 25.0 percent in 2024/25, the secondary sector’s share rose to 13.7 percent from 13.2 percent, and the tertiary sector’s share held steady at 61.8 percent in both years.
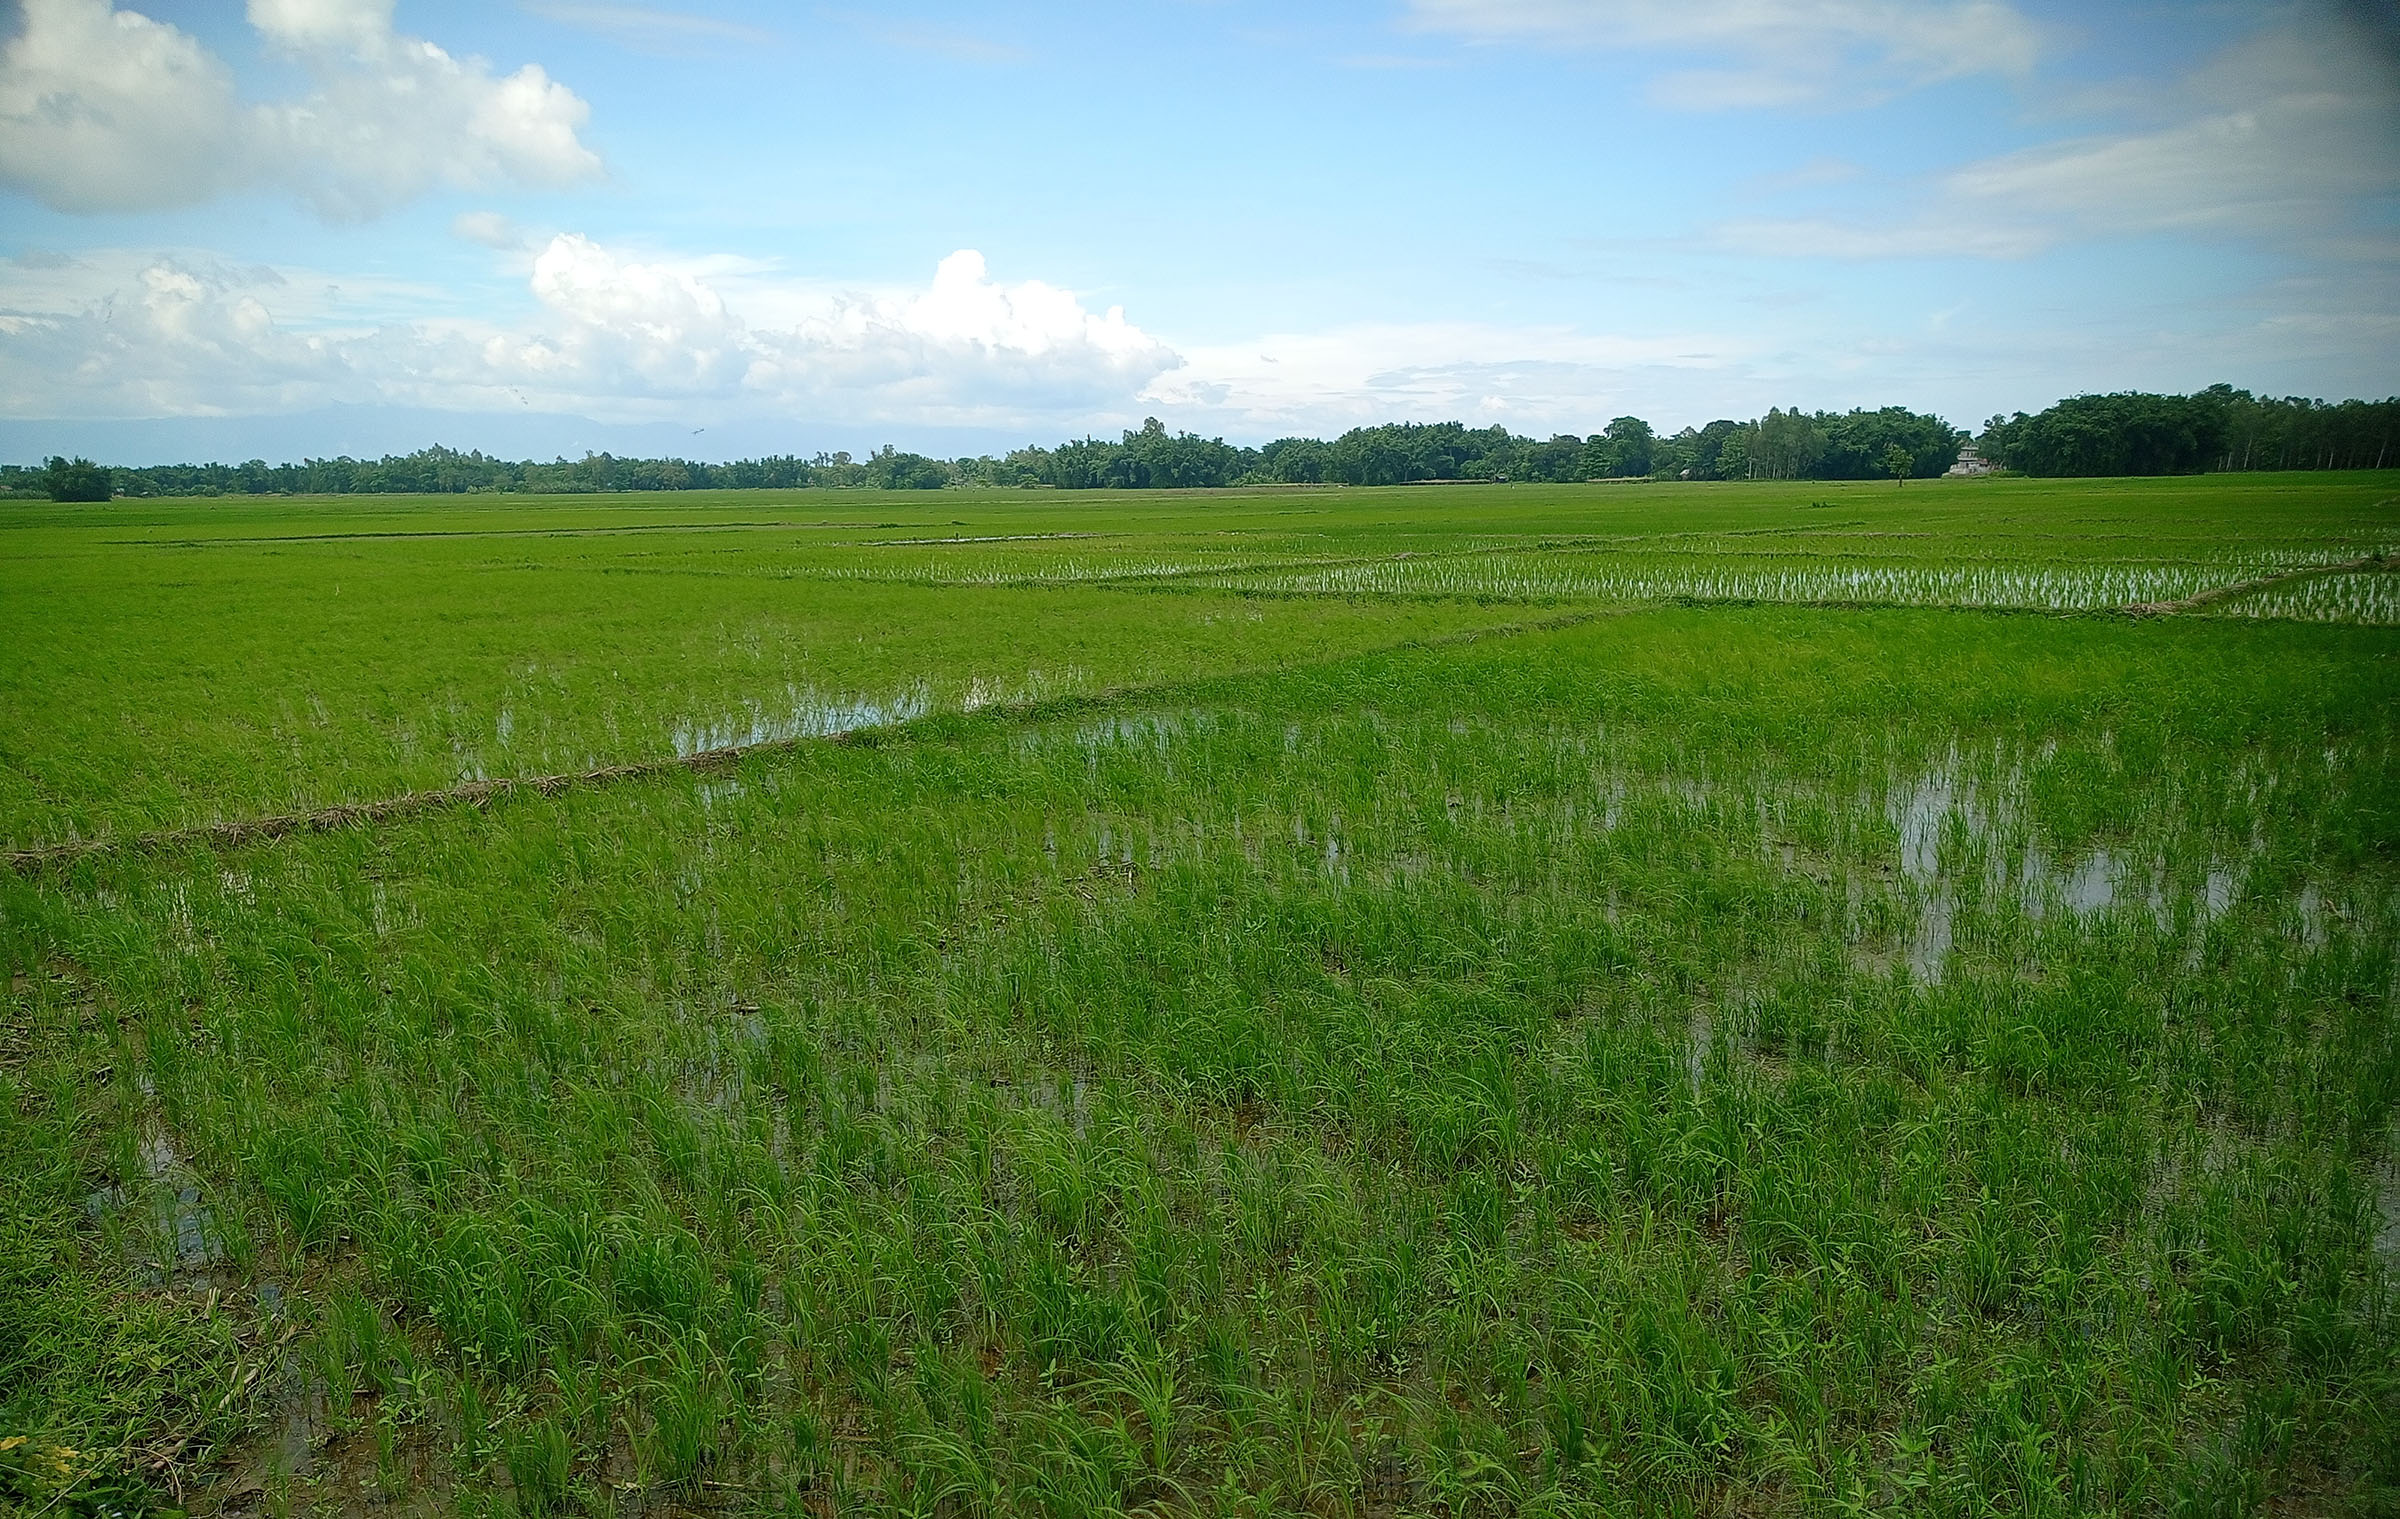
This shows a continuing, gradual decline in agriculture’s relative weight in the economy alongside marginal gains for industry and a stable dominant role for services, which account for well over three-fifths of total output.
The pattern is consistent with a longer-term structural transformation common in developing economies, where the services sector expands as an economy diversifies, though agriculture in Nepal still occupies a considerably larger share than in many peer economies.
Which individual economic activities contribute the most and least to Nepal’s GDP?
Among the 18 economic activities tracked by the NSO, agriculture, forestry and fishing remains the single largest contributor to GDP, accounting for 24.0 percent in 2025/26, followed by wholesale and retail trade at 14.1 percent.
At the other end of the scale, water supply, sewerage, and waste management contributes just 0.40 percent of GDP, and mining and quarrying contributes 0.43 percent, making them the smallest contributors among the 18 categories.
Other notable contributors include real estate activities, financial and insurance activities, education, construction, and public administration, though these were not singled out with individual GDP shares in the executive summary.
The dominance of agriculture and trade reflects Nepal’s continued reliance on farming livelihoods and a large informal trading economy, while the minimal contributions from mining, quarrying, and water utilities point to the underdeveloped state of the country’s extractive and utility infrastructure sectors relative to the rest of the economy.
What do gross output and intermediate consumption figures show about production efficiency across sectors?
Gross output at basic prices, meaning the total value of goods and services produced before deducting the cost of inputs, is estimated at Rs 9.92 trillion in 2025/26, up from a revised Rs 9.38 trillion in 2024/25.
To generate this output, the economy consumed Rs 4.13 trillion worth of intermediate inputs in 2025/26, compared to Rs 3.93 trillion the previous year.
The ratio of intermediate consumption to output, which indicates how much of gross output is used up as inputs rather than becoming value added, stayed broadly stable across most sectors between the two years, except for education and other services, which saw declines of 8 and 5 percentage points respectively.
Manufacturing recorded the highest intermediate consumption ratio at 72.54 percent in 2025/26, followed by accommodation and food services at 71.92 percent and electricity and gas at 64.48 percent.
Real estate activities recorded the lowest ratio at 18.66 percent, followed by education at 19.02 percent, meaning these sectors retain a much larger share of their output as value added.
What are the latest per capita GDP, GNI, and GNDI figures, and how much have they grown?
Nominal per capita GDP for 2025/26 is estimated at USD 1513, an increase of 5.47 percent over the previous year, while real per capita GDP, adjusted for inflation, grew by a smaller 2.90 percent.
Nominal per capita Gross National Income (GNI) is estimated at USD 1535, unchanged from the previous year.
Currencies of different countries
Nominal per capita Gross National Disposable Income (GNDI), which adds net current transfers such as remittances to GNI, is estimated at USD 2,044, up from USD 1,994 the previous year.
The fact that GNDI has grown faster than GDP or GNI, points to the significant role remittance inflows continue to play in boosting disposable income beyond what domestic production alone generates.
How is Nepal’s total consumption expenditure divided among government, households, and non-profit institutions?
Total final consumption expenditure at current prices is estimated at Rs 5.96 trillion in 2025/26. Of this, private consumption expenditure by households accounts for the largest share at 91.3 percent, followed by government final consumption expenditure at 6.6 percent, and consumption expenditure of Non-Profit Institutions Serving Households (NPISHs) at 2.1 percent.
As a share of GDP, total final consumption expenditure is estimated at 90.3 percent in 2025/26, notably lower than the 93.1 percent recorded in 2024/25 and 93.3 percent in 2023/24.
This decline in the consumption share of GDP, even as the absolute value of consumption expenditure rose, indicates that other components of GDP, such as saving and capital formation, grew at a comparatively faster pace this year.
The overwhelming dominance of private household consumption in the total, at over nine-tenths, underscores how central household spending, much of it supported by remittance income, is to driving demand across Nepal’s economy.
What do the figures show about Nepal’s saving and capital formation, and how do they compare with GDP?
Gross domestic saving is estimated at Rs 640.69 billion in 2025/26, equivalent to 9.71 percent of GDP, up from 6.9 percent of GDP in 2024/25.
Gross national saving, which includes net income and transfers from abroad, is far higher at Rs 2.95 trillion, or 44.77 percent of GDP, compared to 38.4 percent in 2024/25.
Gross capital formation, meaning investment in fixed assets and inventories, is estimated at Rs 2.11 trillion, made up of gross fixed capital formation at 82.2 percent of this total and changes in inventories at 17.8 percent.
Gross fixed capital formation itself is estimated at 26.26 percent of GDP in 2025/26, up from 23.6 percent in 2024/25.
The wide gap between domestic saving, sourced purely from within the country, and national saving, which is heavily boosted by remittance inflows from abroad, illustrates how dependent Nepal’s overall saving capacity is on money sent home by migrant workers rather than on income generated domestically.
What is Nepal’s resource gap, and what does it indicate about the economy?
The resource gap for 2025/26 is estimated at Rs 693.48 billion, equivalent to 10.51 percent of GDP, up sharply from 6.60 percent of GDP in 2024/25 and 3.8 percent in 2023/24.
The resource gap measures the difference between what a country invests, in the form of gross capital formation, and what it saves domestically, and a positive gap means that available national savings are not being fully converted into domestic investment.
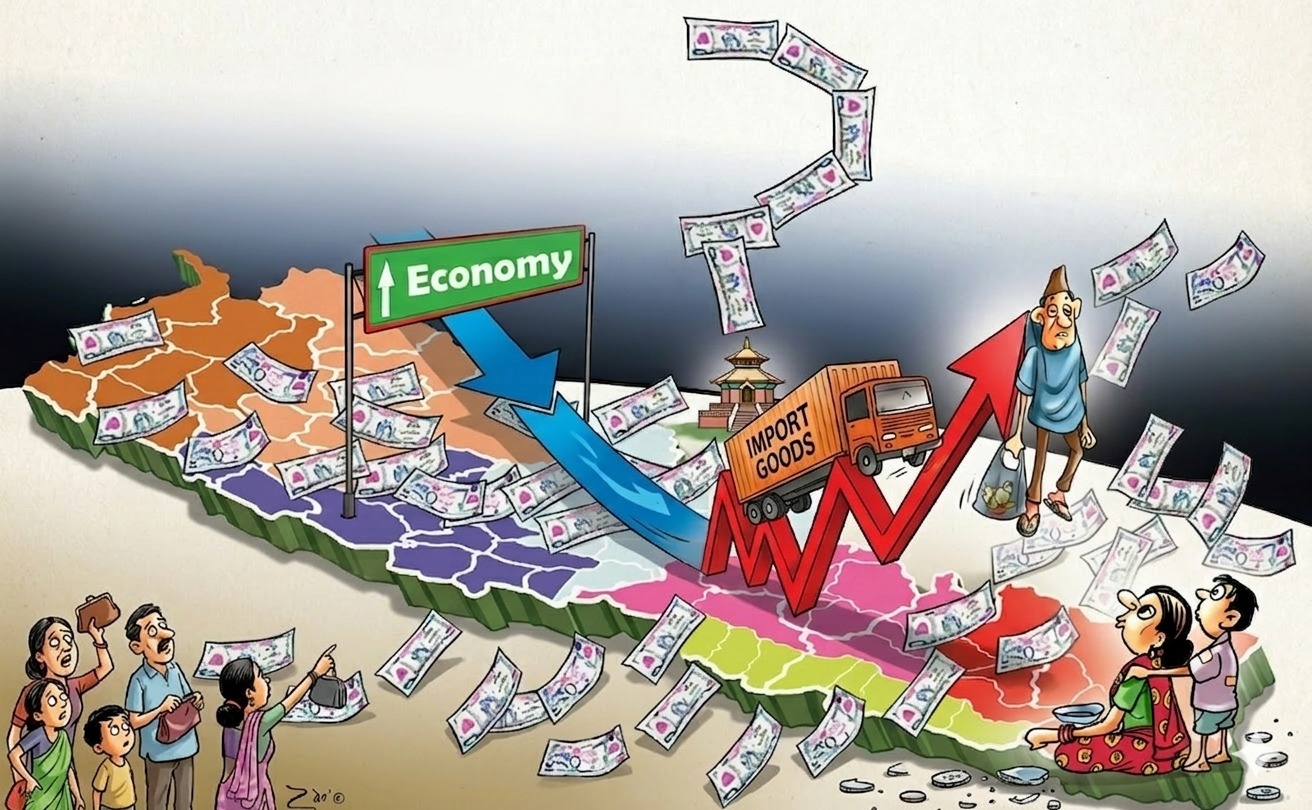
AI generated image of Nepal’s economic status
The near tripling of this gap as a share of GDP over just two years suggests that although gross national saving has grown substantially, driven largely by remittance income, that saving is increasingly not being channeled into productive investment within Nepal.
This can reflect various underlying issues, including limited absorptive capacity for investment, capital flowing abroad, or savings being held rather than invested. A widening resource gap is generally viewed as a signal of untapped economic potential, since resources that could expand the country’s productive base are not being fully utilized for that purpose.
What does the report show about Nepal’s trade in goods and services, including exports, imports, and the trade balance?
Net exports of goods and services are estimated at negative Rs 1.62 trillion in 2025/26, reflecting a large trade deficit.
The export to import ratio is estimated at 28.9 percent for the year, meaning imports are roughly three and a half times the value of exports, indicating that Nepal’s external transactions remain heavily skewed toward imports rather than exports.
As a share of GDP, exports are estimated at 8.55 percent in 2025/26, down from 9.03 percent in 2024/25, while imports are estimated at 21.51 percent of GDP, down from 22.81 percent the previous year.
Both export and import ratios to GDP declined slightly compared to the prior year, though the overall trade imbalance remains substantial. This persistent and deep trade deficit is a long-standing structural feature of Nepal’s economy, reflecting its narrow export base concentrated in a limited range of goods, alongside heavy reliance on imported fuel, machinery, vehicles, and consumer goods to meet domestic demand.
How significant are worker’s remittances to Nepal’s economy, and how has their share of GDP changed?
Worker’s remittances are estimated at 33.02 percent of GDP in 2025/26, up from 27.8 percent in 2024/25 and 25.1 percent in 2023/24, continuing a consistent upward trend over recent years.
This places remittance inflows among the most important sources of income in the Nepali economy, exceeding, for instance, the entire manufacturing sector’s contribution to GDP and rivaling the size of the entire agriculture sector.
The steady rise in remittances as a share of GDP reflects continued high rates of labor migration from Nepal to destinations such as the Gulf countries, Malaysia, and increasingly other markets, alongside currency and wage dynamics that affect the rupee value of money sent home.
Remittances feed directly into household consumption, gross national income, gross national disposable income, and national saving, meaning their growth has ripple effects across nearly every other major macroeconomic indicator covered in this report, from per capita income figures to the national saving rate.
How is national income divided between labor, capital, and government under the income approach?
Compensation of employees, representing wages and salaries paid to workers, is estimated as the largest component of household income at Rs 2.51 trillion in 2025/26, accounting for 38.1 percent of GDP, up from 37.0 percent in 2024/25 and 36.7 percent in 2023/24.
Operating surplus and mixed income, which represents returns to capital and self-employed business income and is calculated as a residual figure under the income approach, is estimated at Rs 3.28 trillion, or 49.7 percent of GDP.
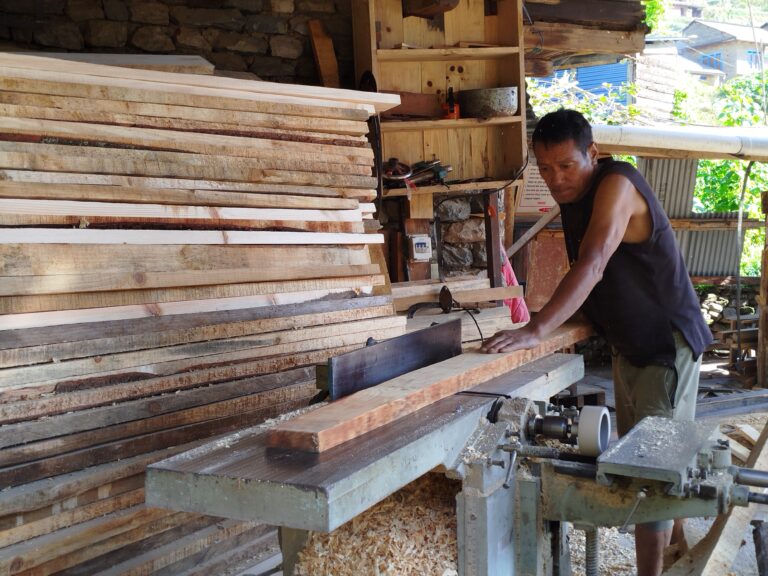
A laborer working at a furniture factory located in Tarakhola Rural Municipality, Baglung. Photo: Bidhya Rai
Taxes less subsidies on production and imports are estimated at Rs 806.57 billion, representing 12.2 percent of GDP. The rising share of compensation of employees relative to GDP suggests wage income has been growing somewhat faster than the overall economy.
As Nepal does not have an independent estimate of operating surplus, this component is derived as a residual after other income components are calculated, rather than being measured directly from source data.
What is Nepal’s total tax burden, and how has it evolved?
Total tax revenue is estimated at 16.8 percent of GDP in 2025/26, roughly stable compared to 16.9 percent in 2024/25 and up from 16.4 percent in 2023/24. This tax to GDP ratio, sometimes referred to as the government’s effort or tax burden indicator, reflects the overall weight of taxation, encompassing both direct and indirect taxes, relative to the size of the economy.
The broadly stable ratio over the three years covered suggests that tax collection has kept pace with overall economic growth without expanding significantly as a share of the economy.
This figure is separate from the taxes-less-subsidies-on-production-and-imports figure used in the income approach breakdown, since the tax to GDP ratio reported among the key macroeconomic indicators captures the total tax take across the economy, which is a broader measure used to assess the government’s overall revenue mobilization performance relative to economic output.
What do the second quarter figures for 2025/26 show about near-term economic momentum?
The seasonally unadjusted GDP growth rate for the second quarter of fiscal year 2025/26 is estimated at 4.05 percent compared to the same quarter of the previous year.
However, on a seasonally adjusted basis, which strips out predictable seasonal patterns to compare consecutive quarters, GDP is estimated to have declined by 2.04 percent in the second quarter compared to the first quarter of the same fiscal year.
Based on the unadjusted estimates, every economic activity recorded positive year-on-year growth in the second quarter. Electricity and gas posted the highest growth at 22.74 percent, followed by financial and insurance activities at 12.51 percent.
Water supply, sewerage, waste management, and remediation activities recorded the lowest growth at 0.55 percent, followed by public administration and defense at 1.11 percent.
The gap between the unadjusted year-on-year growth and the seasonally adjusted quarter-on-quarter decline suggests some loss of momentum within the fiscal year even though the economy was still larger than the same period a year earlier.
How is economic activity distributed across Nepal’s seven provinces, and which provinces are growing fastest and slowest?
Bagmati Province accounts for the largest share of the national economy at purchaser’s prices, contributing 36.7 percent of total output in 2025/26. It is followed by Koshi Province at 15.8 percent, Lumbini Province at 14.2 percent, Madhesh Province at 13.1 percent, Gandaki Province at 9.0 percent, Sudurpashchim Province at 7.0 percent, and Karnali Province at 4.2 percent.
Bagmati holds the largest share in every economic activity except agriculture, forestry, and fishing, where Koshi Province leads with 21.4 percent of the national total in that sector.
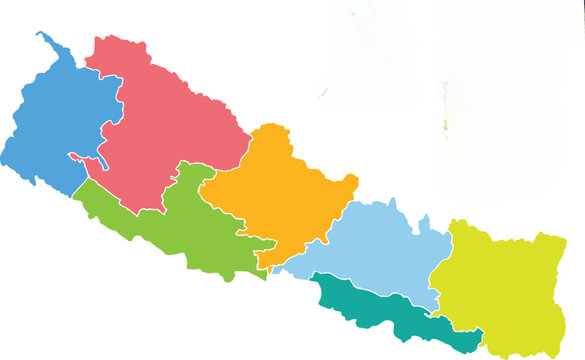
Seven Provinces of Nepal
In terms of economic growth at purchaser’s prices, Bagmati Province recorded the highest growth rate among the seven provinces at 5.4 percent, while Madhesh Province recorded the lowest at 1.31 percent.
This uneven provincial picture reflects Bagmati’s role as the seat of the capital, Kathmandu, and its concentration of trade, finance, government, and service activities, while provinces more dependent on agriculture show slower and more volatile growth patterns.
What methodology and historical background underpin Nepal’s national accounts statistics?
Nepal’s National Statistics Office has been compiling national accounts statistics for more than six decades, having begun the practice in fiscal year 1961/62 and carried it out on a regular basis since 1964/65, following international System of National Accounts (SNA) principles.
The base year used for constant price calculations has been revised five times, moving from 1964/65 to 1974/75, then to 1984/85, 1994/95, 2000/01, and most recently to the current base year of 2010/11, which follows the SNA 2008 framework.
The NSO estimates GDP independently using both the production approach and the expenditure approach, which can produce differing results and create a statistical discrepancy between them, while the income approach is not used as a standalone method due to data limitations, meaning operating surplus and mixed income are derived as residual figures rather than measured directly.
The NSO also compiles quarterly national accounts, begun roughly a decade ago, and provincial GDP estimates, initiated from fiscal year 2018/19 using a top-down method that distributes national industry totals to the provinces based on relevant indicators, reflecting growing demand for subnational economic data following Nepal’s shift to a federal governance structure.