Kathmandu
Tuesday, July 14, 2026





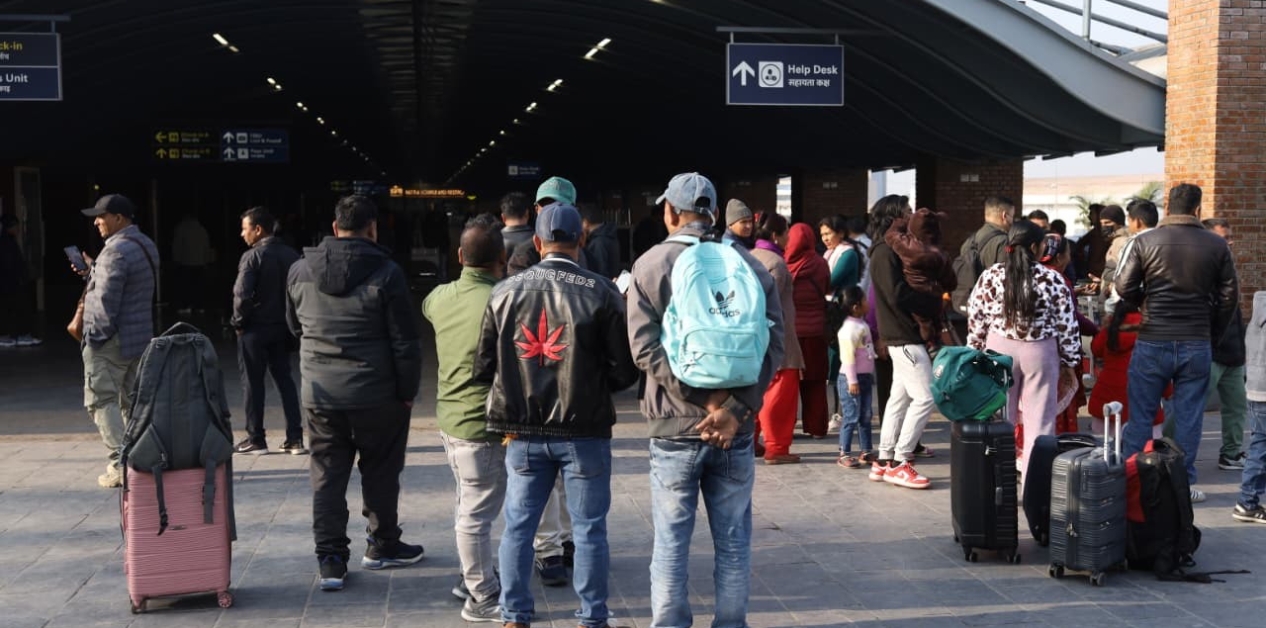
As fiscal year 2025/26 nears its end, Nepal Rastra Bank's latest assessment paints a mixed picture of the economy, with record remittances and foreign exchange reserves strengthening Nepal's external position while rising inflation, a widening trade deficit, sluggish private credit growth, and weak capital spending continue to weigh on the outlook.

KATHMANDU: Nepal Rastra Bank’s Economic Research Department released its assessment of the country’s macroeconomic and financial position on July 13, 2026, covering the eleven months to mid-June 2026 of fiscal year 2025/26.
The report tracks price trends, foreign trade, remittances, the balance of payments, government finances, money supply, banking sector credit, interest rates, and the stock market, offering the clearest official snapshot yet of how Nepal’s economy is behaving heading into the fiscal year-end.
The assement presents a mixed economic picture. Remittances surged 38.2 percent to Rs. 2.12 trillion, foreign exchange reserves climbed 40.3 percent to Rs. 3.76 trillion, and the balance of payments surplus nearly doubled to Rs. 926.06 billion. However, headline inflation accelerated to 5.22 percent, the trade deficit widened to Rs. 1.62 trillion, and domestic credit grew by just 0.5 percent, underscoring persistent structural challenges.
How much have prices risen in Nepal by mid-June 2026?
Consumer prices climbed sharply on a year-on-year basis, with the headline inflation rate reaching 5.22 percent in mid-June 2026, nearly double the 2.72 percent recorded in the same month a year earlier. This acceleration was driven by both halves of the consumption basket: food and beverage prices rose 4.95 percent compared with just 0.54 percent a year ago, while non-food and services prices increased 5.37 percent versus 3.94 percent previously.
Within food items, fruits led the increase at 17.40 percent, followed by ghee and oil at 15.10 percent, meat and fish at 5.26 percent, and vegetables at 4.14 percent, while pulses and legumes were the only category to register a decline, down 0.93 percent. On the non-food side, miscellaneous goods and services jumped 16.68 percent and transportation costs rose 15.31 percent, reflecting the pass-through of costlier fuel imports.
Notably, the eleven-month average inflation rate for the fiscal year actually eased to 2.89 percent from 4.24 percent a year earlier, meaning the recent spike represents a late-year acceleration rather than a sustained high-inflation year overall.
What does wholesale price data suggest about future consumer inflation?
Wholesale price inflation, which often signals where retail prices are headed, surged to 8.47 percent year-on-year in mid-June 2026 compared with a mere 1.56 percent a year earlier, a far steeper rise than the consumer price figure. Within this measure, intermediate goods prices increased 14.64 percent and capital goods prices rose 4.78 percent, while consumption goods prices actually fell 1.00 percent, an unusual divergence suggesting that cost pressures are currently concentrated in production inputs rather than finished consumer items.
Construction material prices rose 3.09 percent over the same period, a relevant figure given the government’s ongoing infrastructure spending programs. Because wholesale prices for intermediate and capital goods typically feed into consumer prices with a lag, this gap between wholesale and retail inflation points to further consumer price pressure building in the pipeline.
Comparatively, India’s consumer inflation stood at only 3.93 percent in May 2026, underscoring that Nepal, despite its currency peg and deep trade dependence on India, is currently experiencing meaningfully higher domestic price pressure than its southern neighbor.
How did Nepal’s merchandise trade perform over the eleven months?
Merchandise exports grew 12.3 percent to Rs.277.97 billion, a much slower pace than the exceptional 77.8 percent growth recorded in the same period a year earlier, indicating the previous year’s export boom is normalizing. Exports to India, Nepal’s dominant trading partner, rose 13.6 percent, while exports to other countries increased 9.2 percent; shipments to China, however, fell sharply by 35.8 percent.
Products like soyabean oil, palm oil, cardamom, noodles, and brans drove the export gains, while zinc sheets, particle board, tea, woolen carpets, and handicrafts all declined.
On the import side, merchandise purchases from abroad rose 15.2 percent to Rs.1,894.10 billion, outpacing the prior year’s 13.1 percent growth, with imports from China rising fastest at 21.5 percent, followed by other countries at 18.9 percent and India at 11.8 percent.
Petroleum products, silver, transport equipment, vehicles, chemical fertilizer, and crude soyabean oil led import growth. Because imports again outran exports, the total trade deficit widened 15.7 percent to Rs.1,616.13 billion, and the export-import coverage ratio slipped to 14.7 percent from 15.1 percent, reaffirming Nepal’s deep and growing reliance on imported goods.
What is driving the record remittance inflows, and how many workers are going abroad?
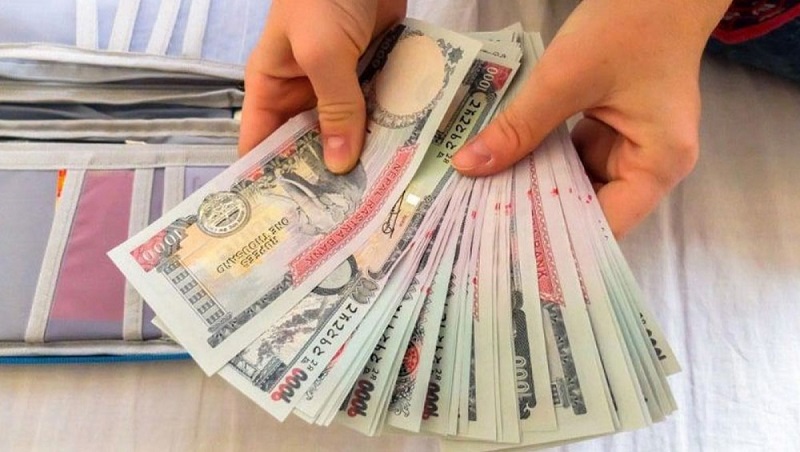
Remittance inflows increased 38.2 percent to Rs.2,120.80 billion during the eleven-month period, a substantially faster pace than the 15.6 percent growth recorded a year earlier, and in the single month from mid-May to mid-June alone, inflows reached Rs.203.89 billion compared with Rs.176.32 billion in the same month last year.
Measured in US dollars, remittances rose 29.6 percent to USD 14.59 billion, up from 12.8 percent growth previously, showing that the gain is not merely a function of currency depreciation but reflects genuinely higher dollar-denominated transfers.
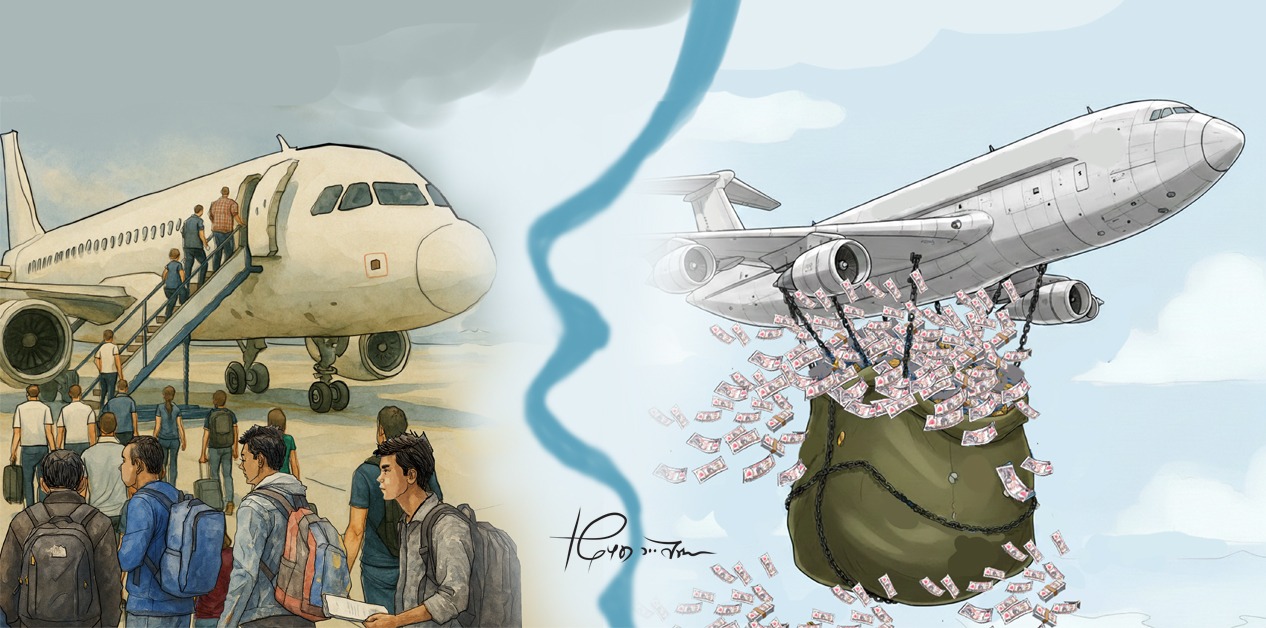
Interestingly, this surge in remittance value came even as the number of Nepali workers securing first-time approval for foreign employment fell to 367,211 from 452,324 a year earlier, and renewed-entry approvals rose modestly to 355,735 from 308,067.
This combination, fewer new departures but far larger money transfers, suggests that existing overseas workers are remitting considerably more per capita, possibly reflecting wage growth in destination labor markets, more formal banking channel usage, or exchange rate-driven incentives to remit through official channels.
What do the current account and balance of payments figures show?
Nepal’s current account posted a surplus of Rs.802.06 billion in the review period, more than double the Rs.321.74 billion surplus of the same period a year earlier, and in US dollar terms the surplus rose to 5.53 billion from 2.37 billion. This improvement was driven primarily by the remittance surge feeding into net secondary income, which reached Rs.2,321.07 billion compared with Rs.1,669.51 billion a year ago, more than offsetting the widening trade deficit and a services account that also improved, with the net services deficit narrowing to Rs.72.54 billion from Rs.82.78 billion.
Net capital transfers rose to Rs.17.03 billion from Rs.8.96 billion, and foreign direct investment in equity form nearly doubled to Rs.22.82 billion from Rs.11.07 billion, though FDI levels remain modest relative to the size of the economy.
Taken together, the overall balance of payments surplus nearly doubled to Rs.926.06 billion, equivalent to USD 6.39 billion, from Rs.491.44 billion, or USD 3.62 billion, a year earlier, reflecting an external position that, on paper, looks unusually comfortable.
How large are Nepal’s foreign exchange reserves now, and how long would they last?
Gross foreign exchange reserves rose 40.3 percent to Rs.3,755.64 billion in mid-June 2026 from Rs.2,677.68 billion in mid-July 2025, equivalent to an increase from USD 19.50 billion to USD 24.68 billion, a 26.5 percent rise in dollar terms. Reserves held directly by Nepal Rastra Bank grew 37.9 percent to Rs.3,330.07 billion, while reserves held by other banks and financial institutions grew even faster, up 61.8 percent to Rs.425.57 billion.
Indian currency accounted for 21.5 percent of total reserves. In terms of adequacy, these reserves are now sufficient to cover 22.5 months of prospective merchandise imports and 19.1 months of combined merchandise and services imports, comfortably above the three-month threshold typically considered a minimum safety benchmark.
The reserves-to-GDP ratio climbed to 61.5 percent from 43.8 percent, the reserves-to-imports ratio rose to 159.5 percent from 128.1 percent, and the reserves-to-M2 ratio increased to 43.7 percent from 34.1 percent, all pointing to a substantially strengthened external buffer compared with a year earlier.
How has the Nepali rupee performed against the US dollar?
The Nepalese currency depreciated 9.8 percent against the US dollar between mid-July 2025 and mid-June 2026, a considerably steeper decline than the 3.0 percent depreciation recorded over the same period a year earlier. In absolute terms, the buying exchange rate moved from Rs.137.0 per dollar to Rs.151.88 per dollar.
Because the Nepali rupee is pegged to the Indian rupee, this depreciation largely mirrors movements in the Indian currency against the dollar rather than reflecting standalone Nepali currency weakness. The scale of this depreciation is notable given that reserves were simultaneously rising and the current account was in surplus, a combination that under a floating exchange rate regime would typically be associated with currency appreciation rather than depreciation.
1672397318.jpg)
This divergence highlights how the peg arrangement disconnects Nepal’s domestic external accounts from its bilateral exchange rate outcome, and it also explains part of the import price inflation feeding into wholesale and retail prices, since a weaker rupee raises the cost of imported fuel, machinery, and other dollar-denominated goods.
What happened to international oil and gold prices, and why does this matter for Nepal?
The price of Brent crude oil in international markets rose 16.63 percent to USD 88.64 per barrel in mid-June 2026 from USD 76.0 per barrel a year earlier, while gold prices increased 21.85 percent to USD 4,185.95 per ounce from USD 3,435.35 per ounce. Because Nepal imports nearly all of its petroleum needs and gold remains a culturally significant import item tied to festivals and weddings, both price increases directly affect the import bill and, through that channel, the trade deficit and consumer inflation.
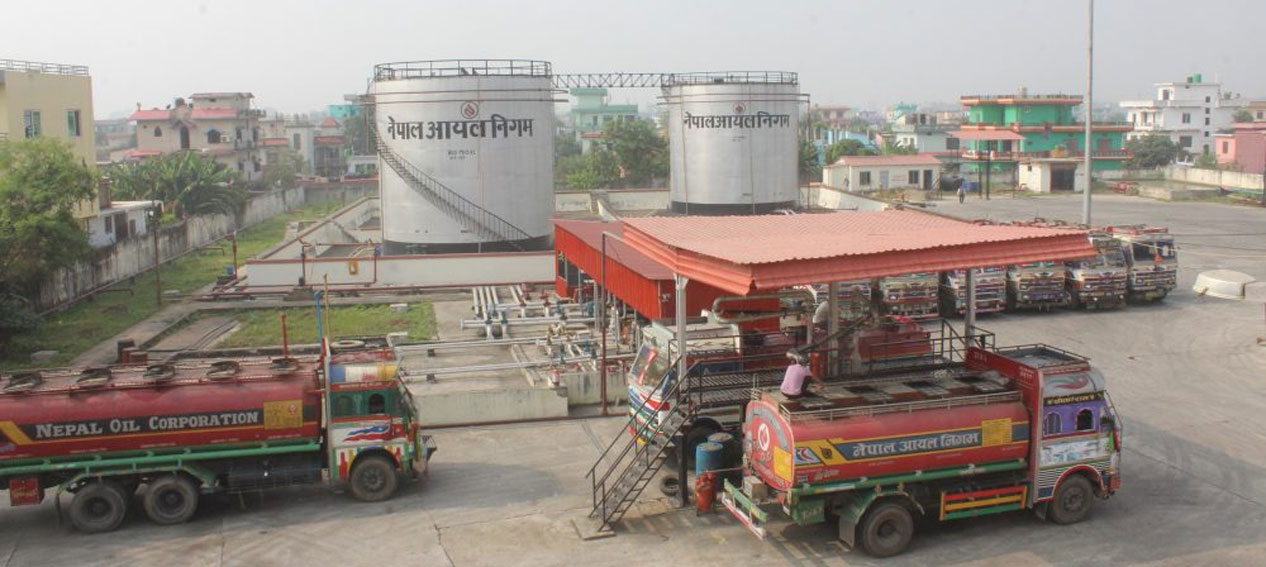
Dhangadhi Oil Depot of Nepal Oil Corporation. File photo
The rise in oil prices in particular helps explain the jump in transportation cost inflation of 15.31 percent noted in the consumer price data, since higher landed fuel costs feed through to public and private transport fares. Combined with the depreciation of the rupee against the dollar, these global commodity price increases compound the imported inflation problem facing Nepali consumers and add pressure to an import bill that was already growing faster than exports, reinforcing the widening trade deficit recorded during the review period.
How did the government’s revenue and spending perform in the eleven months?
Nepal Government’s total expenditure reached Rs.1,346.65 billion during the eleven-month period, up 5.0 percent from Rs.1,282.94 billion a year earlier, a notably slower expansion than the 8.6 percent growth recorded in the prior year. Within this, recurrent expenditure rose 6.7 percent to Rs.908.27 billion, financial management spending rose 6.2 percent to Rs.305.72 billion, while capital expenditure actually contracted 7.5 percent to Rs.132.67 billion, continuing Nepal’s long-standing pattern of underspending on infrastructure and development projects relative to recurrent costs.
On the revenue side, total mobilization reached Rs.1,081.31 billion, growing 6.4 percent, slower than the 10.5 percent growth of the previous year, with tax revenue at Rs.981.35 billion growing 6.9 percent and non-tax revenue at Rs.99.96 billion growing just 1.9 percent.
As expenditure grew faster than revenue in absolute terms, the government continued running a fiscal position that required financing, though its cash balance held at Nepal Rastra Bank rose substantially to Rs.418.54 billion from Rs.137.78 billion a year earlier, suggesting weaker execution of budgeted spending, particularly on the capital side, alongside adequate liquidity.
What do broad money and reserve money figures tell us about monetary conditions?
Broad money supply, or M2, grew 9.8 percent during the eleven-month review period, slightly faster than the 8.2 percent growth recorded a year earlier, and on a year-on-year basis M2 expanded 14.2 percent by mid-June 2026. This growth was substantially driven by net foreign assets, which increased by Rs.926.06 billion, or 34.7 percent, well above the Rs.491.44 billion, or 24.7 percent, increase seen a year earlier, directly reflecting the remittance-driven balance of payments surplus described above.
Reserve money, meanwhile, grew far more modestly at just 2.8 percent during the review period compared with 6.4 percent a year earlier, though its year-on-year growth stood at 12.2 percent, a deceleration attributable to Nepal Rastra Bank’s active use of open market operations and bond issuance to absorb the liquidity being generated by the inflow of foreign currency.
This divergence between fast-growing M2 and slow-growing reserve money illustrates the central bank’s deliberate sterilization strategy, mopping up excess liquidity from foreign currency inflows to prevent it from feeding directly into domestic credit expansion and inflation.
How has domestic credit growth and its allocation between government and private sector changed?
Domestic credit expanded by just 0.5 percent during the eleven-month period, sharply down from 3.4 percent growth in the same period a year earlier, and stood 3.1 percent higher on a year-on-year basis by mid-June 2026. This overall slowdown masks two very different underlying trends.
The monetary sector’s net claims on government fell 35.1 percent during the review period, an even steeper decline than the 22.0 percent drop recorded a year earlier, reflecting the improved cash position of the government noted above and reduced reliance on domestic borrowing.
Claims on the private sector, meanwhile, grew 7.0 percent during the review period, only slightly slower than the 8.7 percent growth of a year earlier, with year-on-year growth of 6.4 percent. This pattern shows that credit growth in the banking system is now being driven almost entirely by private borrowers rather than government financing needs, a healthier composition in principle, though the modest single-digit pace of private credit growth also signals continued caution among both banks and borrowers regarding new lending and investment.
What changes occurred in bank deposits during the period?
Deposits at banks and financial institutions increased 10.3 percent, equivalent to Rs.748.62 billion, reaching a total of Rs.8,012.49 billion, faster than the 8.0 percent, or Rs.517.60 billion, growth recorded a year earlier, with year-on-year deposit growth reaching 15.0 percent by mid-June 2026.
The composition of these deposits shifted meaningfully: savings deposits’ share of the total rose to 46.6 percent from 36.2 percent a year earlier, while the share of fixed deposits fell sharply to 37.3 percent from 50.2 percent, and demand deposits edged up to 6.9 percent from 5.7 percent. This shift away from fixed deposits toward savings and demand deposits likely reflects falling fixed deposit interest rates making longer-term lock-ins less attractive relative to more liquid account types.
The share of institutional deposits within total BFI deposits also declined slightly to 33.7 percent from 35.5 percent a year earlier, indicating that individual household deposits, boosted significantly by the remittance surge, are now representing a somewhat larger share of the banking system’s deposit base than institutional or corporate deposits.
What is the current level of interest rates in Nepal’s banking system?
Interest rates across the banking system declined broadly over the year to mid-June 2026, reflecting the ample liquidity generated by strong remittance inflows and reserve accumulation. The weighted average 91-day treasury bill rate fell to 2.64 percent from 2.94 percent a year earlier, while the interbank rate among banks and financial institutions eased to 2.73 percent from 2.99 percent.
Base rates, which anchor lending costs, dropped substantially for commercial banks to 4.88 percent from 6.09 percent, for development banks to 6.86 percent from 8.29 percent, and for finance companies to 7.16 percent from 9.02 percent. Correspondingly, weighted average deposit rates for commercial banks fell to 3.29 percent from 4.29 percent, and lending rates fell to 6.64 percent from 7.99 percent, with similar declines recorded for development banks and finance companies.
This broad-based decline in the cost of both deposits and loans indicates that Nepal’s banking system currently has more liquidity available than it can profitably deploy, a condition consistent with the sluggish private credit growth figures described earlier despite falling borrowing costs.
What do financial soundness indicators reveal about the health of Nepal’s banking sector?
As of mid-June 2026, Nepal’s banking sector comprised 106 banks and financial institutions in total, including 20 commercial banks, 17 development banks, 17 finance companies, 51 microfinance institutions, and one infrastructure development bank, operating through 11,344 branches, a reduction from 11,526 branches in mid-July 2025 as the sector continued consolidating its physical footprint.
On capital strength, the core capital to risk-weighted assets ratio of banks and financial institutions stood at 9.70 percent on average, with total capital to risk-weighted assets at 12.63 percent, both indicating institutions are maintaining buffers above regulatory minimums. The net liquid assets-to-deposits ratio stood at a comfortable 36.26 percent, further reflecting the liquidity surplus in the system.
However, the non-performing loan ratio, measured as of mid-April 2026, stood at 5.60 percent, a level that, while not alarmingly high, represents asset quality strain worth monitoring given the broader environment of slow private credit growth and rising import and input costs squeezing some borrowers, particularly in interest-rate-sensitive sectors like construction and finance-linked real estate.
How has Nepal’s stock market performed, and what does the listing activity show?
The benchmark NEPSE index stood at 2,724.03 points in mid-June 2026, modestly higher than 2,655.39 a year earlier, while total stock market capitalization rose to Rs.4,654.55 billion from Rs.4,423.04 billion, though the ratio of market capitalization to GDP actually eased slightly to 70.52 percent from 71.34 percent as nominal GDP grew faster than the market.
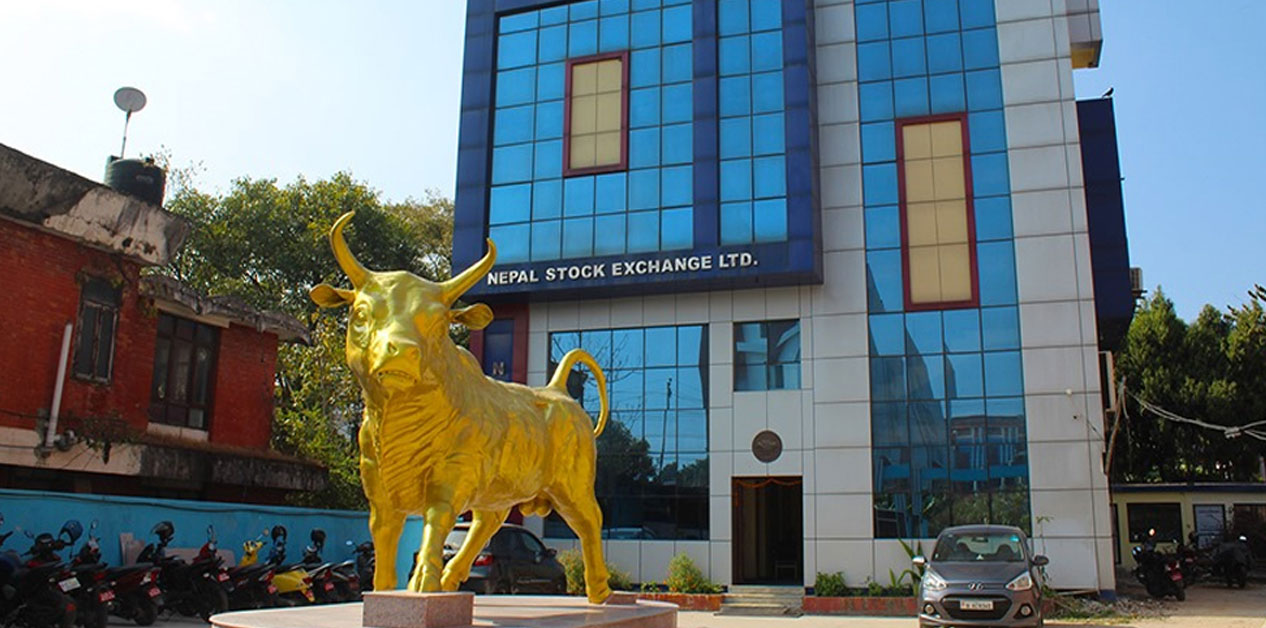
Nepal Stock Exchange. File photo
The number of companies listed on the exchange increased to 297 from 272, with banks, financial institutions and insurance companies still dominating both listings, at 133 companies, and market capitalization share, at 50.9 percent, followed by hydropower companies at 105 listings and 17.5 percent of market value.
During the review period, Rs.147.15 billion worth of new securities were listed, split across ordinary shares, bonus shares, right shares, mutual funds, and debentures, while the Securities Board of Nepal approved public issuances totaling Rs.53.73 billion, dominated by mutual fund offerings worth Rs.37.03 billion.
This pattern of modest index gains alongside continued reliance on the financial sector for market value suggests the equity market remains narrowly based and closely tied to the fortunes of the banking sector rather than reflecting broader economic diversification.

![PM Shah attends house session for first time since border remark controversy [Photo Feature]](https://english.nepalnews.com/wp-content/uploads/2026/07/balen-rabi-9.jpg)