Kathmandu
Sunday, July 26, 2026





An economy growing, borrowing and sending its workers abroad, all at once

KATHMANDU: Every year, before presenting the national budget, Nepal’s Finance Minister places an Economic Survey before Parliament. This document is the government’s most comprehensive official assessment of how the economy performed during the outgoing fiscal year.
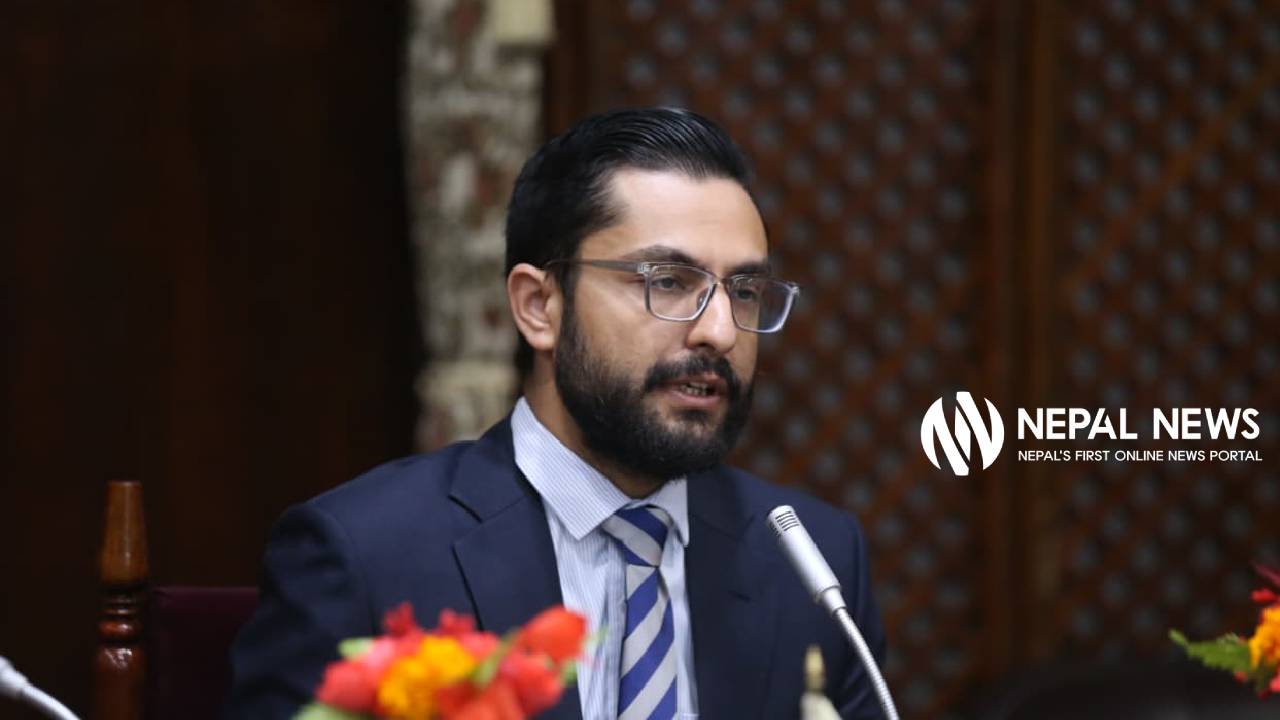
On Wednesday, Finance Minister Dr. Swarnim Wagle tabled the Economic Survey for fiscal year 2025/26 at a session of the House of Representatives. The survey draws on data from the National Statistics Office and Nepal Rastra Bank to measure growth, inflation, trade, public finances, remittances, banking, energy, and social development.
It is the authoritative official record of where Nepal’s economy stands as the country prepares its next annual budget.
At what rate is Nepal’s economy estimated to grow in fiscal year 2025/26, and what is the total size of the economy?
Nepal’s economy is estimated to grow at 3.85 percent in real terms during fiscal year 2025/26, measured at purchasers’ prices. This is a step down from the 4.43 percent growth recorded in fiscal year 2024/25.
In nominal terms — evaluated at current market prices — the gross domestic product is estimated to reach Rs 6.6 trillion. This is roughly Rs 400 billion higher than the previous fiscal year’s nominal GDP.
When measured at basic prices — before adding taxes on products and subtracting subsidies — GDP stands at Rs. 5.79 trillion, with a slightly lower real growth rate of 3.68 percent.
The Rs 804 billion difference between the two measures represents net taxes on products.
Although 3.85 percent falls well short of the government’s own 6 percent target, it exceeded projections from major international institutions: the World Bank had forecast 2.3 percent, the Asian Development Bank 2.7 percent, and the International Monetary Fund 3 percent.
Which sectors performed best and which dragged the economy down?
The electricity, gas, and water supply sector was Nepal’s fastest-growing part of the economy in fiscal year 2025/26, expanding at approximately 20.93 percent. Although it contributes only 2.08 percent to total GDP, its pace of growth stood apart from every other sector.
The commissioning of 14 new hydropower projects during the year significantly expanded Nepal’s installed generation capacity and drove this outcome. Finance and insurance was the second-strongest performer at 9.16 percent.
Wholesale and retail trade grew at 4.51 percent, accommodation and food services at 3.12 percent, manufacturing at a modest 2.83 percent, and construction at 2.21 percent.
Agriculture, contributing 24.03 percent to GDP, grew at only 1.58 percent — the weakest sectoral performance outside general administration.
In broad terms, the primary sector grew at 1.63 percent, the secondary sector at 5.77 percent, and the tertiary sector at 4.21 percent.
Industry was actually the strongest broad sector this year, lifted almost entirely by hydropower.
Why is agriculture so weak, and what does that mean for rural Nepal?
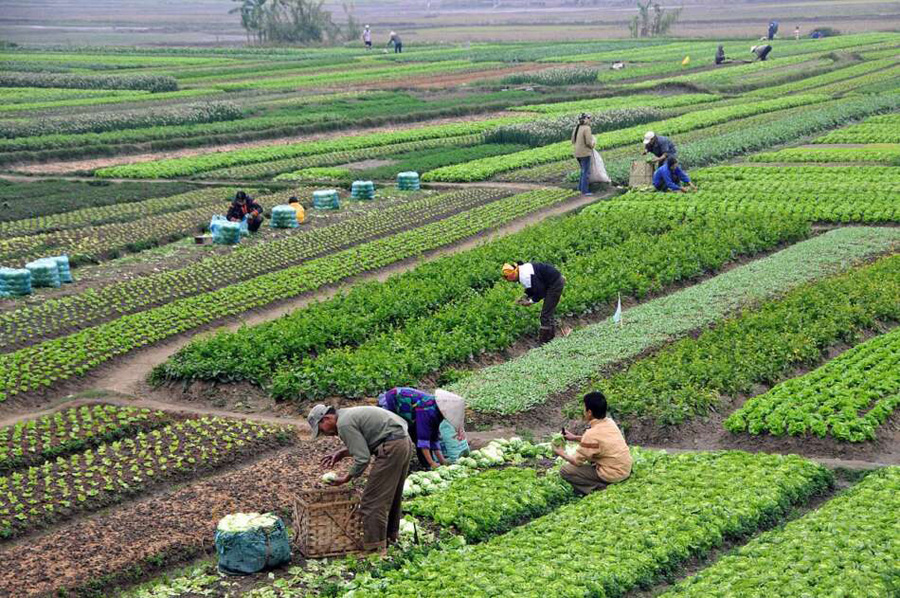
Agriculture’s growth of 1.58 percent in fiscal year 2025/26 reflects the combined damage of a sequence of extreme weather events that disrupted the farming cycle across the country.
Unseasonal rainfall in 2025 — linked partly to the influence of Cyclone Montha in the Bay of Bengal — caused widespread damage to standing paddy crops. This followed drought conditions during the transplantation season in June 2025, especially severe in Madhesh Province, Nepal’s most fertile and food-productive region.
File Photo
Floods in October 2025 then destroyed much of what remained in the fields. Paddy production fell by an estimated 4.16 percent. Some recovery came from gains in legumes and cereals, which softened the overall decline without reversing it.
Agriculture contributes 24.03 percent of GDP today, down from 33.45 percent a decade ago in fiscal year 2010/11, reflecting the longer-term shift toward services and migration.
Yet it remains the primary livelihood of the majority of Nepal’s population, meaning even modest growth failures translate into real hardship for rural households with few alternative income sources.
What has happened to remittances, and how important are they to the economy?
Remittances now account for 33.02 percent of GDP in fiscal year 2025/26, up sharply from 27.80 percent the year before — the highest ratio ever recorded.
In the first eight months of the fiscal year alone, remittance inflows grew by 37.7 percent compared to the same period a year earlier, reaching Rs 1,449.65 billion.
In fiscal year 2024/25, total annual remittance inflows equalled 28.2 percent of GDP, a figure almost matching the entire annual goods import bill.
Approximately 839,000 Nepali workers received labor permits to go abroad in fiscal year 2024/25. By mid-March 2026, over 557,000 had already received permits in the current fiscal year.

AI-generated image illustrating Nepal’s heavy reliance on remittance inflows from Gulf countries.
Over the preceding decade, the annual outflow of workers for foreign employment grew at an average of 28.6 percent each year.
The survey acknowledges both sides of this dynamic. Remittances support household consumption, reduce poverty, and stabilize the balance of payments.
But, the continuous departure of working-age people depletes agricultural and industrial labor, suppresses domestic wages, reduces the incentive for structural reform, and deepens the economy’s dependence on income generated entirely outside its borders.
What is the current state of Nepal’s foreign exchange reserves?
By mid-April 2026, Nepal’s gross foreign exchange reserves reached Rs. 3,494.73 billion — equivalent to approximately USD 23.55 billion — an increase of 30.5 percent from mid-July 2025 levels.
This is a record high. Of the total, reserves held directly by Nepal Rastra Bank grew by 27.7 percent to Rs. 3,082.41 billion, while reserves at commercial banks and other financial institutions rose by 56.8 percent.
The Indian rupee’s share of total reserves was 20.4 percent. These reserves are sufficient to cover prospective merchandise imports for 21.8 months and combined merchandise and services imports for 18.4 months — well above the internationally accepted minimum of three months.
The reserves-to-GDP ratio reached 57.2 percent and the reserves-to-M2 ratio stood at 41.2 percent. This strong external cushion supports currency stability and reflects massive remittance inflows.
The survey notes, however, that this comfort rests on conditions in foreign labor markets that Nepal does not control.
What is the status of Nepal’s public debt?
Nepal’s public debt has more than doubled over the past decade and now stands at 43.8 percent of GDP. The total debt stock reached Rs. 2,676 billion by the end of fiscal year 2024/25 and is projected to rise further to approximately 45.2 percent of GDP by the close of fiscal year 2025/26.
Debt servicing has grown to consume approximately 21 percent of the entire federal budget this year, leaving sharply reduced room for development investment.
Around 53 percent of total public debt is domestic. Approximately 85 percent of foreign-currency debt is held on concessional terms from multilateral lenders including the World Bank, Asian Development Bank, and the International Monetary Fund.
Beyond the headline figure, the survey flags a hidden liability: unpaid government obligations from multi-year development contracts total approximately Rs 402 billion, of which only Rs 128 billion has been budgeted for the current year, leaving a further Rs. 274 billion as future spending pressure.
Health insurance claims owed but not yet paid add a further Rs. 16.87 billion to these off-budget obligations.
How did the government manage revenues and expenditures in fiscal year 2025/26?
In the first eight months of fiscal year 2025/26, the federal government collected Rs. 747.28 billion in revenue against total expenditure of Rs. 926.59 billion. Revenue collection reached only 50.5 percent of the full-year annual target by mid-March 2026.
The government’s consolidated fund carried a negative balance of approximately Rs. 117 billion as of mid-March 2026, meaning cash outflows exceeded inflows and routine operations were being partly funded through borrowing.
Current expenditure — salaries, subsidies, and administration — amounted to Rs. 482.108 billion in the first six months.
Capital expenditure on infrastructure and development projects reached only 11.66 percent of the annual capital budget allocation, amounting to Rs. 47.54 billion over the same period.
This imbalance between recurrent and development spending is one of Nepal’s most chronic fiscal problems. Over the past decade, current expenditure has averaged 66.8 percent of total government spending, consistently crowding out capital investment.
Accumulated public financial irregularities — payments made without proper authorization or documentation — now exceed Rs. 700 billion.
What is the scale of Nepal’s trade deficit and how has it evolved?
Nepal’s merchandise trade deficit is both deep and structural. Over the preceding decade, the average annual deficit equalled 29.7 percent of GDP.
As of February 2026, goods exports covered only 14.8 percent of goods imports, meaning Nepal imported approximately seven times as much in physical goods as it sold abroad.
In the ten months of fiscal year 2025/26 from July 17, 2025, to May 14, 2026, total recorded external trade reached Rs. 1,941 billion. Within this, merchandise imports amounted to Rs. 1,692 billion while goods exports reached Rs. 248.96 billion.
India accounts for 59.5 percent of Nepal’s total foreign trade in the current fiscal year. There is, however, a modest longer-term improvement: goods and services exports as a share of GDP rose from 5.12 percent in fiscal year 2020/21 to 9.97 percent in 2025/26.
Much of this gain is driven by electricity exports to India and tourism service revenues. The underlying deficit continues to be financed primarily by remittances rather than by export earnings.
How is the electricity and hydropower sector changing Nepal’s economic picture?
The electricity, gas, and water supply sector grew at approximately 20.93 percent in fiscal year 2025/26, making it by far the fastest-expanding part of Nepal’s economy.
Fourteen new hydropower projects were commissioned during the year, adding meaningfully to installed generation capacity.
The sector contributes 2.08 percent to total GDP — still modest in absolute terms but growing at pace. The expansion of hydropower has enabled Nepal to increase electricity exports to India, contributing to the improvement in export ratios.

File photo
Beyond exports, expanding generation is reducing the import bill for petroleum products, lowering input costs for industry, and supporting economic activity more broadly.
The survey acknowledges, however, that Nepal has not yet fully captured the wider economic potential of its growing power sector. Manufacturing and industrial activity remain underdeveloped relative to the energy resources now coming available.
Capturing that potential requires building stronger domestic industrial linkages with cheap power and securing long-term cross-border electricity trade arrangements.
What is the condition of Nepal’s banking sector and how is credit flowing?
As of mid-April 2026, 106 banks and financial institutions operated across Nepal through 11,401 branches. Deposit accounts at class A, B, and C licensed institutions exceeded 62.4 million.
Total deposits grew by 9.5 percent year-on-year, reaching Rs. 6,729.62 billion compared to Rs. 6,145.88 billion in the corresponding period of the previous year.
Despite this liquidity, private sector credit grew by only 4.4 percent during the first eight months of the year. Banks hold surplus cash but lending has stalled because business investment demand is weak.
Capital adequacy remains sound — core capital relative to risk-weighted assets stands at 9.72 percent and total capital adequacy at 12.62 percent, both above regulatory minimums.
However, non-performing loans have been rising across the banking system. The increase in bad debts has forced institutions to set aside large provisions against potential losses, constraining their appetite for fresh lending and compounding the already subdued private investment environment.
What has happened to inflation and the cost of living?
Consumer price inflation moderated considerably in fiscal year 2025/26. The average inflation figure for the first eight months of the year stood at 2.13 percent — well below the 4.1 percent annual average in fiscal year 2024/25 and significantly lower than the 6.08 percent of fiscal year 2022/23.
Year-on-year inflation in mid-March 2026 was 3.62 percent, rising to 4.47 percent by mid-April 2026 as fuel cost pressures returned partly from tensions in West Asia.
Inflation varies markedly across provinces. In mid-April 2026, Lumbini Province recorded the highest consumer price inflation at 5.15 percent, followed by Koshi at 4.98 percent and Madhesh at 4.91 percent. Bagmati stood at 4.20 percent, Gandaki at 3.85 percent, Karnali at 3.82 percent, and Sudurpashchim the lowest at 3.39 percent.
Nepali households on average spend approximately 48 percent of their income on food, 19 percent on non-food goods, and 33 percent on services, making food prices the most consequential determinant of household welfare.
How is the tourism sector faring?
Tourism faced significant pressures in fiscal year 2025/26. Between August 2024 and March 2025, Nepal received 798,510 visitors, a 1.7 percent increase from 785,362 in the corresponding period of the prior year.
Tourism earnings during this window grew by 9.7 percent to Rs. 56.70 billion, compared to Rs. 51.69 billion previously. In 2024, the average tourist stayed 13.3 days and spent an average of USD 40.8 per day.
For the broader fiscal year, however, the sector encountered sharper difficulties. Geopolitical tensions in West Asia disrupted air routes and pushed up jet fuel costs, reducing arrivals during the peak March-to-May tourist season.

File Photo
Domestic unrest in late 2025 also weighed on visitor confidence. The accommodation and food services sub-sector is projected to grow at only 3.12 percent for the full year.
Structurally, Nepal’s tourism earnings remain constrained by low average daily spend per visitor, over-dependence on a narrow base of source markets, and inadequate aviation and ground infrastructure to support higher-value visitor experiences.
How do provincial economies vary across Nepal’s seven provinces?
The Economic Survey maps economic performance across all seven provinces. Only Bagmati Province, which encompasses Kathmandu and the capital region, and Gandaki Province are projected to grow above the national average of 3.85 percent.
Gandaki’s economy is estimated at Rs. 548 billion, contributing 8.97 percent to the national GDP, with growth driven by tourism and services.
The remaining five provinces — Koshi, Madhesh, Lumbini, Karnali, and Sudurpashchim — are all projected to record growth below the national average.
Karnali and Sudurpashchim, the most geographically remote and historically underserved, continue to lag most.
Provincial capital budget execution tells a parallel story: Lumbini spent only 32.36 percent of its capital budget in the first nine months, Karnali spent only 12.97 percent, and Sudurpashchim only 16.42 percent.
Federal funds are reaching provincial accounts but are not being converted into actual infrastructure and services at anywhere near the pace intended.
What is the role of labor migration in the economy and what risks does it carry?
Labor migration for foreign employment has become structurally embedded in Nepal’s economy.
Approximately 839,000 Nepali workers received government labor permits to work abroad in fiscal year 2024/25 alone.
By mid-March 2026, more than 557,000 had already received permits in fiscal year 2025/26. Over the preceding decade, the annual number of workers obtaining foreign employment permits grew at an average rate of 28.6 percent.
The vast majority go to Gulf Cooperation Council nations and Malaysia, primarily in construction, domestic services, and manufacturing. The income they send home now equals 33.02 percent of GDP, the highest share ever recorded.
The survey is frank about the structural risk. The continuous departure of working-age people hollows out the agricultural and construction workforce, suppresses domestic wages, weakens the incentive for employers to improve productivity, and deepens a cycle in which households see little reason to invest in domestic enterprise when foreign wages offer more reliable returns.
The economy’s stability now rests substantially on labor conditions in countries Nepal has no influence over.
How is household consumption and savings structured?
Nepal’s economy is heavily consumption-led. Final consumption expenditure is projected at Rs. 5,950 billion in fiscal year 2025/26, equivalent to 90.29 percent of GDP. This is a marginal improvement from 93.11 percent in the previous year, suggesting a slight uptick in the domestic savings rate.
Nepali households allocate approximately 48 percent of their income to food, 19 percent to non-food items, and 33 percent to services. At the household level, savings from domestic income remain thin at around 9.71 percent of disposable income.
When remittances received from abroad are counted as national income — as they are in the national accounts — gross national savings rise to an estimated 44.77 percent of GDP, up from 38.39 percent in the previous year.
This distinction matters: Nepal as a nation saves a large share of its income, but the bulk of those savings originate from workers earning abroad rather than from productive domestic activity.
The gap between national savings and domestic investment continues to reflect the economy’s dependence on external income flows.
What does Nepal’s current account and balance of payments position look like?
Nepal’s external payments position remained healthy through fiscal year 2025/26, underpinned by surging remittances. By mid-March 2026, after eight months of the fiscal year, the current account surplus reached Rs. 552.85 billion.
By mid-April 2026, after nine months, this had expanded further to Rs. 618.68 billion. The overall balance of payments also recorded a surplus for the period.
Foreign exchange reserves at USD 23.55 billion as of mid-April 2026 are sufficient for 21.8 months of merchandise imports and 18.4 months of combined merchandise and services imports.
The survey cautions that this external strength is structurally dependent on remittances rather than export competitiveness or productive foreign direct investment, making it sensitive to shocks in foreign labor markets, policy changes by host countries toward migrant workers, or disruptions in the main remittance corridors from the Gulf and Malaysia.
What are the key risks in Nepal’s public financial management?
The survey presents a candid inventory of fiscal governance weaknesses. Accumulated public financial irregularities — payments made without proper authorization, documentation, or legal basis — have exceeded Rs. 700 billion in total, pointing to persistent failures in expenditure control.
Unpaid government liabilities from multi-year development contracts amount to approximately Rs. 402 billion, of which only Rs. 128 billion has been budgeted in the current fiscal year, leaving the remainder as an undisclosed burden on future budgets.
The federal government’s consolidated fund was in deficit by approximately Rs. 117 billion as of mid-March 2026, meaning routine operations are being partly funded through borrowing.
Revenue collection in the first eight months reached only 50.5 percent of the full-year target. Provincial and local governments contribute below 10 percent of total federal revenue, limiting subnational capacity to stimulate their own economies.
Foreign grants have been declining, and the increasing reliance on loans rather than grants is tightening the available fiscal space going forward.
How is the manufacturing sector performing and what is driving its partial recovery?
Manufacturing contributes 5.72 percent to Nepal’s GDP and is estimated to have grown at 2.83 percent in fiscal year 2025/26, improving from 2.27 percent in the previous year.
In current price terms, manufacturing’s gross value added reached approximately Rs. 331 billion, up from Rs. 309 billion. The sector had contracted badly by 9.03 percent during fiscal year 2019/20 amid the COVID-19 disruption, then contracted again by 2.02 percent in fiscal year 2023/24, before returning to positive growth.
The recovery in 2025/26 is attributed to increased output in cement, concrete products, ghee, soybean crude oil, iron rods, tobacco goods, wiring cables, jute products, and beer. Growing raw material imports — including soybean crude, zinc sheets, and iron inputs — have also supported domestic production.
The 2.83 percent figure is progress but not a structural shift. Nepal’s manufacturing base remains constrained by high finance costs, poor transport infrastructure, policy inconsistency, and until recently, unreliable power supply — the last of which is now slowly improving through hydropower expansion.
What do per capita income figures tell us about living standards?
Per capita gross domestic product — the average value of production per person within the country — is estimated to have slipped marginally to approximately USD 1,513 in fiscal year 2025/26, from USD 1,516 in the previous year.
Per capita gross national income — which includes net income earned abroad by Nepali citizens, primarily remittances — is estimated at approximately USD 1,535, broadly unchanged.
The near-stagnation of dollar-denominated per capita income despite positive economic growth reflects the appreciation of the US dollar against the Nepali rupee, which erodes rupee-term gains when converted to dollars.
Over the longer term the picture is more positive: Nepal has achieved a remarkable reduction in extreme poverty, from approximately 55 percent of the population in 1995 to below 0.37 percent by 2023, measured at the USD 2.15 per day threshold.
However, broader poverty measures remain significant, and the economy has not generated enough quality domestic employment to provide adequate livelihoods for its growing workforce without heavy dependence on foreign labor markets.
What are the overarching structural challenges the survey identifies for Nepal’s economic future?
The Economic Survey 2025/26 presents an honest accounting of both Nepal’s genuine progress and its entrenched vulnerabilities.
Public debt has doubled in a decade and debt servicing now absorbs 21 percent of the annual federal budget. Capital budget execution is chronically low, with most provinces spending less than a third of their development allocations by late in the fiscal year.
Revenue consistently falls short of targets, and accumulated financial irregularities exceed Rs. 700 billion. The goods trade deficit means imports are approximately seven times goods export earnings.
Private investment demand is weak, non-performing loans are rising across the banking sector, and credit grew at only 4.4 percent.
Agriculture, which still supports the majority of the rural workforce, is acutely exposed to climate disruption, as this year’s paddy losses demonstrated.
The economy’s dependence on remittances at 33.02 percent of GDP — the highest ever — is simultaneously a source of near-term stability and a long-term structural vulnerability.
On the other side, foreign exchange reserves at a record USD 23.55 billion provide a meaningful buffer, the electricity sector is expanding rapidly through new hydropower, manufacturing is recovering modestly, and the goods and services export ratio has been trending upward.
The survey’s implicit message to policymakers is clear: these strengths need to be converted into durable domestic growth momentum before the risks on the liability side compound further.