Kathmandu
Friday, July 17, 2026





NRB's latest Financial Stability Report shows healthy profits and strong capital buffers, but a three-year rise in bad loans, worsening asset quality and stress-test results suggest deeper structural weaknesses beneath the banking sector's reassuring headlines
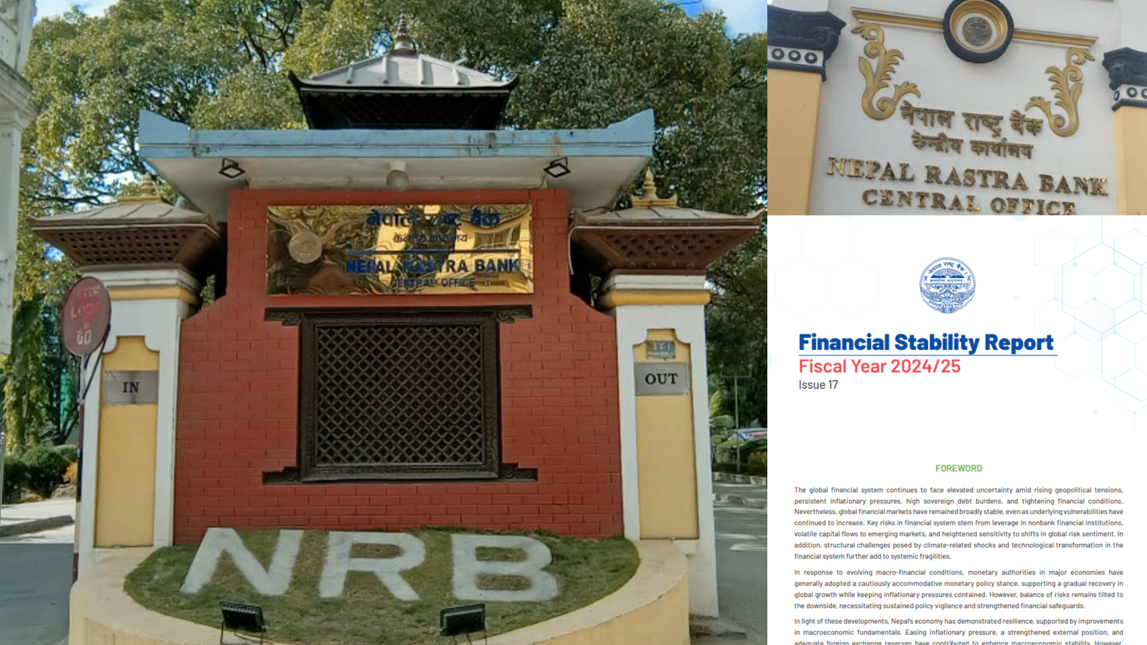
KATHMANDU: There is a particular kind of financial report that says one thing in its headline sentence and something considerably more urgent three paragraphs later. Nepal Rastra Bank’s (NRB) seventeenth Financial Stability Report is that kind of document. Read the executive summary quickly and you will come away reassured: capital adequacy above regulatory minimums, liquidity comfortable, leverage sound, profits up 10 percent.
Read the same report slowly, sector by sector, stress test by stress test, and a different picture forms: one in which the single metric that actually measures whether the banking system is doing its core job, lending money that gets paid back, has been deteriorating for three straight years, and NRB’s own language calls it “the single largest challenge” the system faces. Both readings are true. The tension between them is the story.
Start with the number that should not be buried
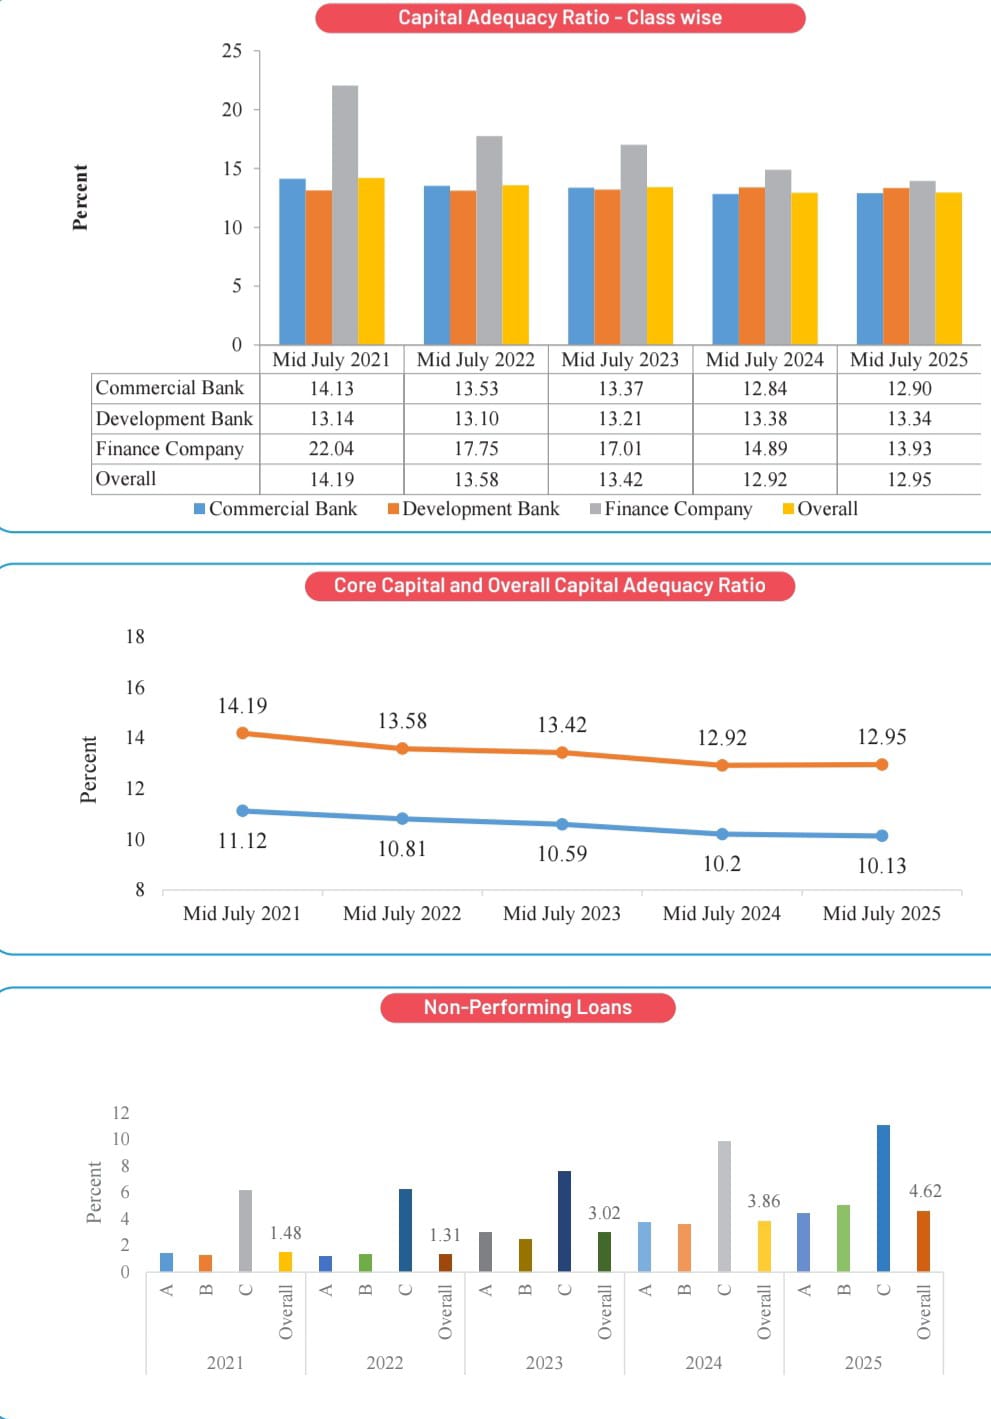
The non-performing loan ratio for Nepal’s banks and financial institutions stood at 4.62 percent as of mid-July 2025, up from 3.86 percent a year earlier. On its own, that single data point might read as a modest uptick — three-quarters of a percentage point in one year is not, by itself, catastrophic. But strip away the year-on-year framing and look at the trajectory NRB provides across five years: 1.48 percent in mid-2021, 1.31 percent in mid-2022, 3.02 percent in mid-2023, 3.86 percent in mid-2024, 4.62 percent in mid-2025. The ratio has more than tripled since its post-pandemic low. That is not noise. That is a structural trend running through three consecutive fiscal years, across a period when GDP growth was recovering, inflation was easing, and remittances were rising 19.2 percent.
In other words, the loan book has been getting worse even as most of the surrounding macroeconomic weather improved. That divergence is the analytical puzzle worth sitting with, because it suggests the asset-quality problem is not simply a function of a bad macro year that will self-correct as growth returns. It looks more like the arrival, with a lag, of stress that had been building in borrowers’ balance sheets for years — stress that a temporarily comfortable liquidity environment and loan restructuring facilities had been masking.
Consider the rupee figures behind the ratio. Non-performing loans across BFIs rose from Rs 199.66 billion to Rs 258.19 billion in a single year, a jump of roughly 29 percent. To put that in perspective, that one-year increase in the stock of bad loans — nearly Rs 59 billion — is close to the entire net profit the whole BFI sector generated in the same year, Rs 77.53 billion.
The banking system, in effect, is generating profit with one hand while a shadow claim on that profit, in the form of newly impaired assets requiring provisioning, grows with the other. This is the arithmetic seasoned credit analysts watch closely in any banking system under strain: when the flow of new bad loans in a single year approaches the scale of annual profit, the system’s ability to absorb further deterioration without eating into capital narrows meaningfully, even if today’s capital ratio still clears the regulatory bar.
Why the composition of bad loans matters more than the headline ratio
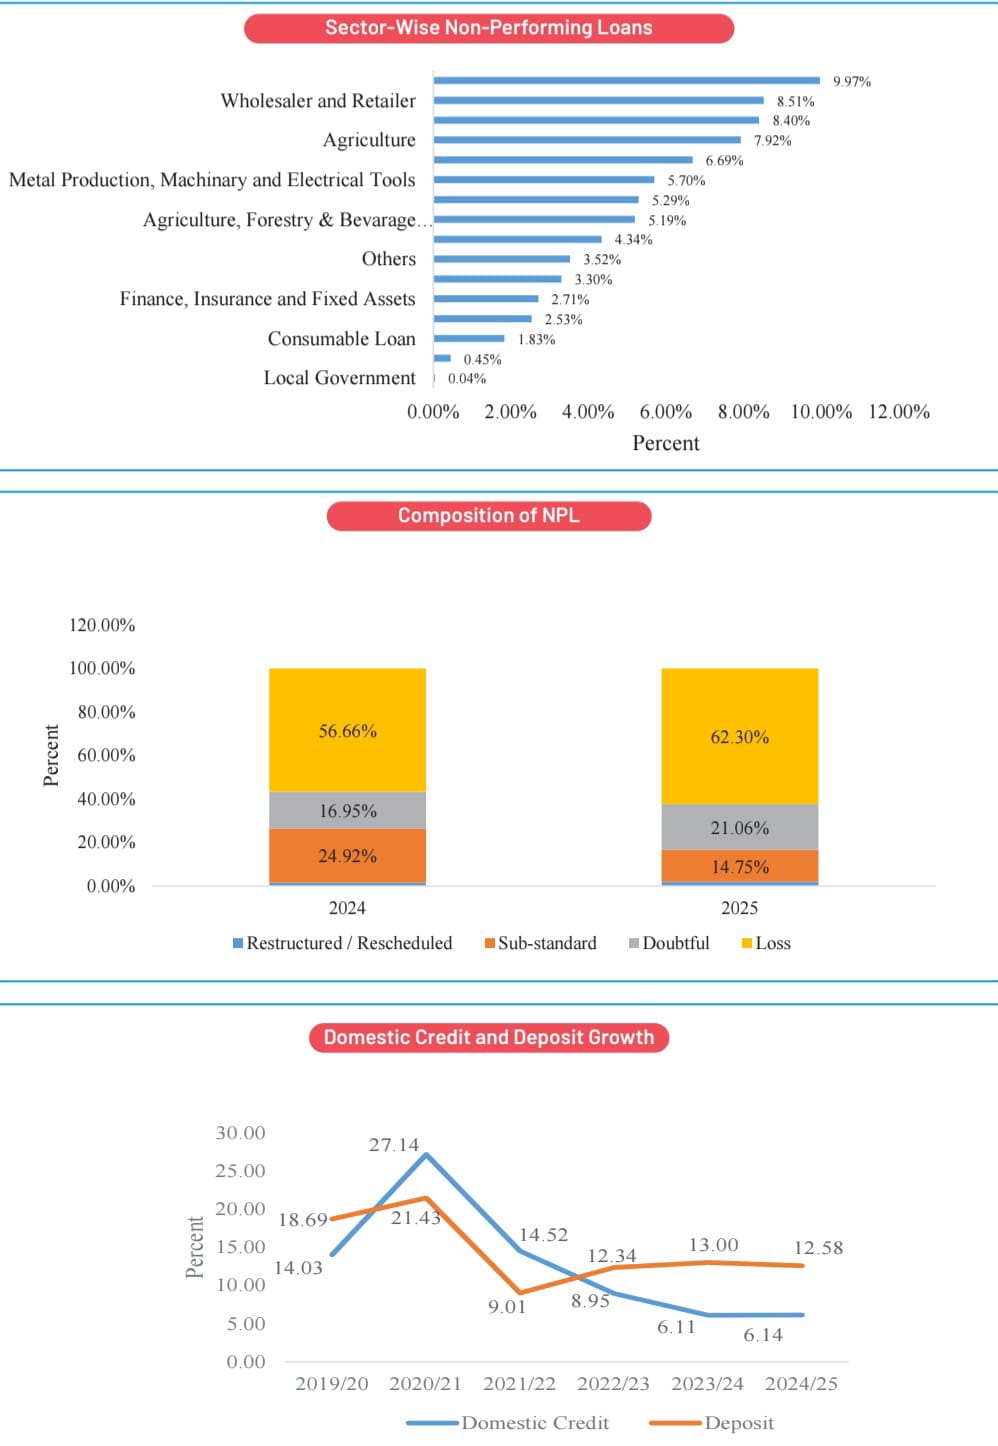
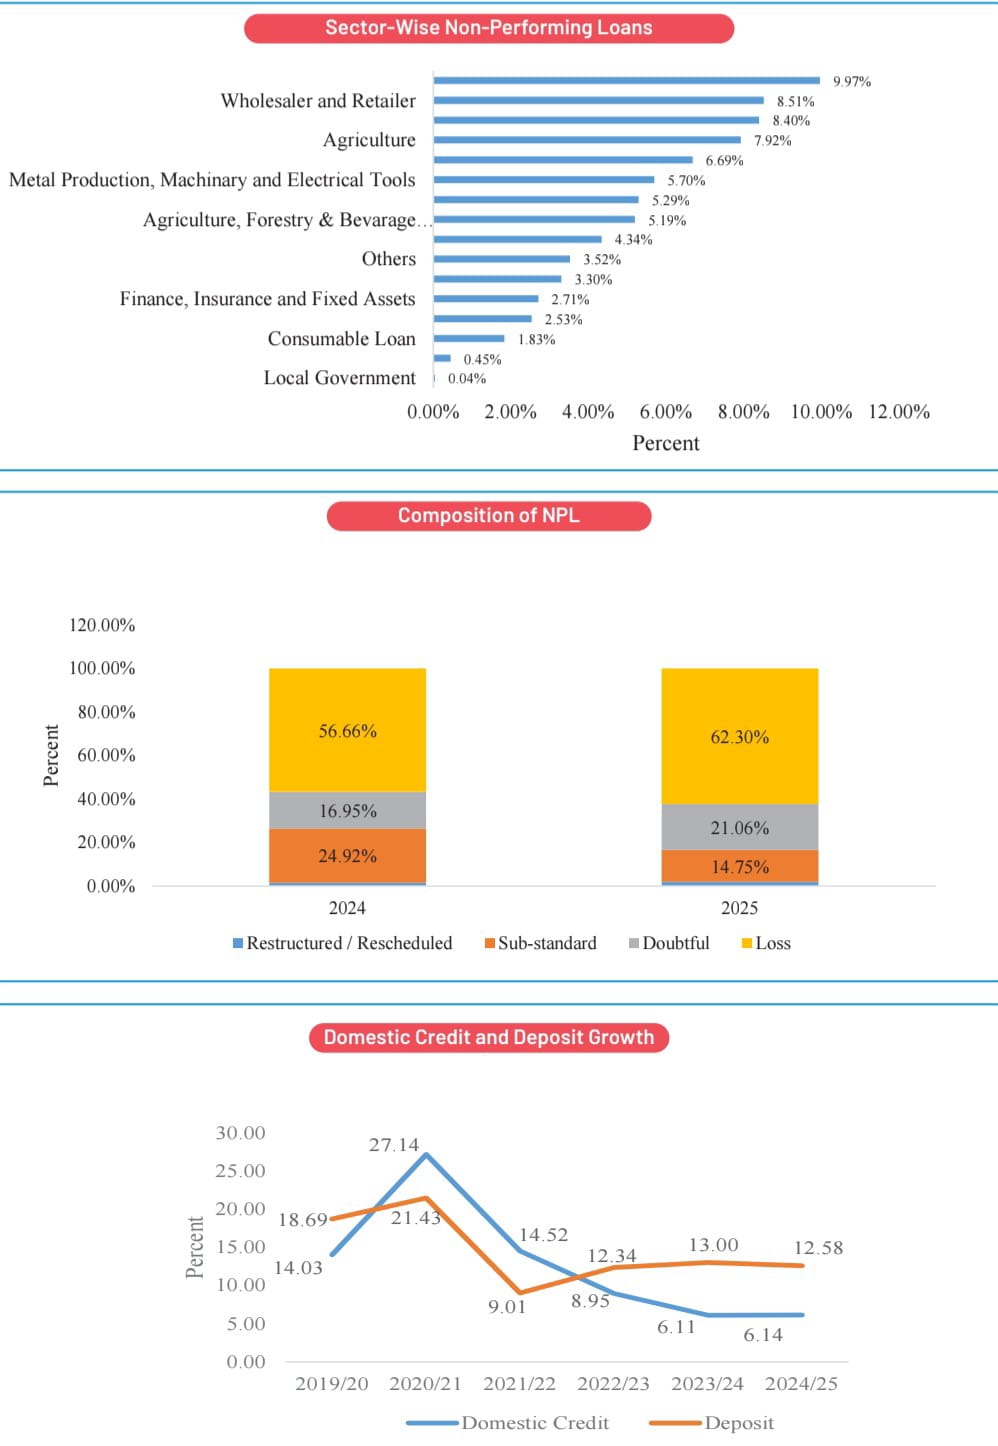
A 4.62 percent NPL ratio, by itself, is not unusual by regional emerging-market standards. What should worry a careful reader more is the composition shift within that pool of bad loans. NRB classifies non-performing loans into four buckets — restructured/rescheduled, sub-standard, doubtful, and loss — and the migration between these categories over the past year tells a story of ageing, hardening distress rather than fresh, recoverable delinquency. The loss category, reserved for loans banks consider essentially unrecoverable, rose from 56.66 percent of total NPLs to 62.30 percent. The doubtful category rose from 16.95 percent to 21.06 percent.
Meanwhile, the restructured/rescheduled category — loans given a second chance through revised repayment terms rather than written off — shrank from 24.92 percent to 14.75 percent of the total NPL pool.
Think of a hospital triage analogy here, because it captures the dynamic precisely. A rising admissions count is concerning on its own. But if the composition of that rising admissions count shifts from “stable, treatable” toward “critical, palliative,” the situation has moved from a capacity problem to a survival-rate problem. That is roughly what has happened inside Nepal’s NPL pool over the past year. Fewer distressed borrowers are being nursed back through restructuring; more are sliding into the terminal loss category. NRB’s own text acknowledges this directly, noting that the shift shows “signs of deterioration in asset quality with a rise in the non-performing loans of the loss category.” This composition shift is arguably more diagnostic than the headline ratio, because it tells you the direction of travel within the existing stock of bad debt, not just its size.
The sectoral fingerprint: real economy stress, not banking mismanagement
One of the more useful things the report does is disaggregate NPLs by economic sector, and the resulting fingerprint points toward stress in the real economy rather than poor underwriting discipline concentrated in any single institution. Fishery loans carry the highest NPL ratio at 9.97 percent. Wholesale and retail trade follows at 8.51 percent, construction at 8.40 percent, agriculture at 7.92 percent, and transportation, communications and public services at 6.69 percent. Contrast this with electricity, gas and water loans at just 0.45 percent, and local government loans at a negligible 0.04 percent.
This is not a random distribution. It maps closely onto which parts of the Nepali economy have genuinely struggled with demand, working capital cycles, and land-and-property-linked collateral values over the past several years, versus which parts have benefited from steady, often subsidized or regulated cash flows. Electricity and gas was, not coincidentally, one of the three sectors the report credits for driving FY2024/25’s GDP growth acceleration to 4.61 percent from 3.67 percent. Construction and real-estate-adjacent lending, by contrast, has been exposed to a property market that has been sluggish for several years running, while wholesale and retail trade sits directly exposed to weak consumption growth and thin margins amid high import costs.
Fishery loans carry the highest NPL ratio at 9.97 percent. Wholesale and retail trade follows at 8.51 percent, construction at 8.40 percent, agriculture at 7.92 percent, and transportation, communications and public services at 6.69 percent.
Agriculture carries its own structural vulnerabilities — climate exposure, fragmented landholding, thin formal insurance penetration — that make loan recovery slower and costlier even when the underlying business is not fundamentally unviable. The picture that emerges is of a banking sector whose loan book is a fairly faithful mirror of an uneven, two-speed economy: pockets of real growth in regulated infrastructure-linked sectors, and continued stress in trade, construction and agriculture, the sectors that employ and bank the largest share of ordinary borrowers.
The stress tests: where “resilient” meets its limits
If the NPL trend is the slow-burning fuse, NRB’s own stress tests are the closest thing in this report to a fire drill, and they deserve more attention than they typically receive in commentary on these reports. Under baseline, pre-shock conditions, all 20 commercial banks maintained a capital adequacy ratio at or above the 11 percent regulatory threshold, and 15 of the 20 already carried NPL ratios below 5 percent. That is the reassuring baseline the executive summary leans on.
But push even one lever, and the picture changes quickly. If 15 percent of currently “pass” (performing) loans were downgraded to substandard — a plausible scenario if economic conditions worsened moderately — every single one of the 20 commercial banks would see its NPL ratio cross above 5 percent, and six banks would see capital adequacy fall into the 8.5–11 percent band, below the comfort zone regulators prefer, though still above outright breach.
Push further: combine five different credit-deterioration assumptions simultaneously, a scenario NRB itself constructs and labels “C-1 a to e combination,” and eight of the 20 banks would fall below the 8.5 percent capital adequacy threshold, eleven more would sit in the 8.5–11 percent band, and only a single bank among all 20 would remain comfortably above 11 percent.
Read that again: under a combined, moderately severe credit-shock scenario that NRB itself designed and ran, 19 of 20 commercial banks in Nepal would no longer sit comfortably above the regulatory capital threshold. This is precisely the kind of finding that should reframe how confidently anyone reads the phrase “well-capitalised” in the executive summary. Capital adequacy today is a snapshot under current conditions, not a guarantee under stressed ones — and the stress the report itself models is not exotic.
Fifteen percent of pass loans deteriorating to substandard, in an economy where the fishery, trade, and construction NPL ratios already sit between 8 and 10 percent, is not a tail-risk scenario invented for regulatory theatre. It is closer to an extrapolation of the trend already visible in the sector-wise NPL data.
The liquidity stress tests carry a similar lesson, though the starting position is more comfortable. A simulated five-day run — deposit withdrawals of 2, 5, 10, 10 and 10 percent on consecutive days — would leave two of 20 commercial banks illiquid by day five. A single-day withdrawal of 20 percent of non-fixed deposits would push twelve banks’ net liquid assets ratio below the 20 percent regulatory floor. And the report flags a structural vulnerability many depositors would not intuit from the headline liquidity ratio: deposit concentration.
The top five deposit-holding banks control 35.23 percent of total system deposits, up from 33.43 percent the year before, and three state-owned banks alone hold 16.58 percent. If the top five institutional depositors at any bank pulled out simultaneously, six banks would face liquidity problems. Nepal’s banking liquidity, in other words, is comfortable in aggregate but concentrated in its sourcing — a small number of large depositors, likely institutional treasuries, provident funds and large corporates, hold outsized influence over any individual bank’s actual liquidity resilience, regardless of what the system-wide ratio suggests.
The profitability paradox, and why it should not be read as good news alone
Here is where a less careful reading of this report goes wrong. BFIs collectively posted a net profit of Rs 77.53 billion in mid-July 2025, up 10.07 percent from the year before. Return on equity actually improved, from 9.67 percent to 10.00 percent. On the surface, this looks like a banking sector shrugging off its bad-loan problem and still delivering for shareholders.
But profitability and asset quality interact with a lag, not simultaneously, and that lag is the mechanism worth understanding. When a loan turns non-performing, a bank does not instantly write off the full amount against current-year profit; it provisions against expected losses over time, based on the loan’s classification (substandard, doubtful, loss) and applicable provisioning norms. This means today’s reported profit can still look healthy even as the underlying loan book deteriorates, because the full provisioning cost of a worsening NPL trend shows up gradually, not all at once.
The report’s own Banking Stability Indicator captures this nuance better than the raw profit figure does: the profitability sub-index sits at 0.47 in mid-2025, a middling-to-elevated risk score, not a clean bill of health, and NRB’s own commentary explicitly states that “decreasing return-on-assets (RoA) and return-on-equity (RoE) have degraded the profitability indicator” as part of the broader composite deterioration, even in years the headline ROE number improved.
There is no contradiction here once you separate stock from flow: reported net profit is a flow measure for one year; the accumulating NPL stock is a claim on future flows of profit through provisioning, and that claim is growing faster than profit itself, at roughly 29 percent versus 10 percent year-on-year. A bank can report a good year and still be watching its future earning capacity erode, if the composition of its loan book is shifting the way this report documents.
Where the smaller institutions are absorbing the sharpest edge of this stress
Averages hide distribution, and nowhere is that more evident in this report than in the gap between commercial banks and the smaller tiers of the financial system. Commercial banks, the largest and most closely supervised institutions, saw their NPL ratio rise from 3.76 percent to 4.44 percent — a meaningful but comparatively contained deterioration. Development banks saw a steeper climb, from 3.62 percent to 5.03 percent.
Finance companies, already carrying double-digit NPL ratios, rose from 9.87 percent to 11.05 percent. And microfinance institutions — the tier serving Nepal’s smallest borrowers, often in rural and agricultural livelihoods — saw the sharpest deterioration of all, from 6.31 percent to 9.95 percent, alongside a 30.26 percent jump in overdue loans and a 32.94 percent jump in loan-loss provisioning needs.
This tiering matters for both financial-stability and social-policy reasons. Microfinance institutions in Nepal exist explicitly to serve borrowers underserved by commercial banks — small farmers, rural entrepreneurs, women’s cooperatives, informal-sector workers. A near-10 percent NPL ratio in this tier is not simply a banking-sector statistic; it is a proxy for genuine repayment distress among some of the most economically vulnerable borrowers in the country, likely linked to the same agricultural and rural-trade stress visible in the sector-wise NPL breakdown at the commercial-bank level.
It also raises questions about whether microfinance lending practices — often built around group-liability models with limited collateral — have kept pace with the deteriorating repayment environment, or whether growth targets at these institutions outpaced prudent underwriting during the low-NPL years of 2021-2022, only to surface now.
The blacklisting curve as the borrower-side mirror
If NPLs are the bank-side symptom, the Credit Information Bureau’s blacklisting data is the borrower-side confirmation, and it is worth dwelling on because it strips away any suggestion that this is purely a technical banking-sector phenomenon. The number of blacklisted borrowers rose from 16,987 in fiscal year 2020/21 to 129,974 by fiscal year 2024/25 — more than a seven-fold increase in four years. The annual growth rate of new blacklistings peaked at a startling 90 percent in fiscal year 2022/23, and while it has moderated since, it still ran at 37.5 percent in the most recent fiscal year.
Every one of those nearly 130,000 blacklisted names represents an individual or firm now formally locked out of further formal credit access, in many cases also facing restrictions on professional licensing and foreign travel for business. This is not an abstraction sitting inside a bank’s provisioning spreadsheet; it is a rapidly growing population of Nepali borrowers for whom the formal financial system has already closed its doors.
The moderation in the growth rate from 90 percent to 37.5 percent is worth noting as a genuinely positive signal — the pace of new distress is slowing, even if the cumulative stock keeps growing — but a 37.5 percent annual growth rate in blacklisted borrowers is still, by any conventional benchmark, a rapid expansion of financial exclusion.
The macro backdrop: liquidity without demand, and a fiscal engine running on one cylinder
None of this is happening in a vacuum, and the report’s own macroeconomic data supplies the missing half of the explanation. Private sector credit growth from BFIs came in at just 8.4 percent for FY2024/25, described by NRB itself as having “fallen short of projection.” Deposit growth, at 12.6 percent, comfortably outpaced credit growth, leaving the banking system with a liquidity glut it has struggled to deploy productively — a classic sign of weak investment demand rather than a supply-side credit crunch.
More recent in-year data the report cites for the first ten months of fiscal year 2025/26 shows this trend deepening rather than reversing: private sector credit grew by just Rs 312.00 billion (5.7 percent), down from Rs 368.68 billion (7.3 percent) in the same period a year earlier, even as deposits grew by Rs 685.41 billion (9.4 percent), up sharply from Rs 399.81 billion (6.2 percent) the year before.
NRB, in the same period, absorbed a staggering Rs 37,266.60 billion in liquidity through deposit collection auctions, the Standing Deposit Facility and bond issuance — nearly double the Rs 19,235.65 billion absorbed in the equivalent period a year earlier, an unmistakable sign of a banking system swimming in idle deposits with nowhere productive to lend them.
Layer onto this the government’s own fiscal execution problem: in the first ten months of fiscal year 2025/26, capital expenditure stood at just Rs 113.85 billion against total government spending of Rs 1,173.52 billion — under 10 percent of the total, with recurrent expenditure at Rs 814.66 billion dwarfing capital spending nearly seven to one. The report explicitly names “persistent underutilization of capital expenditure” as a structural drag on economic activity. This matters directly for the NPL story, because government capital spending — roads, irrigation, energy infrastructure — is precisely the kind of demand injection that would give private construction, trade and transport firms the order books and cash flow needed to service the very loans currently turning bad.
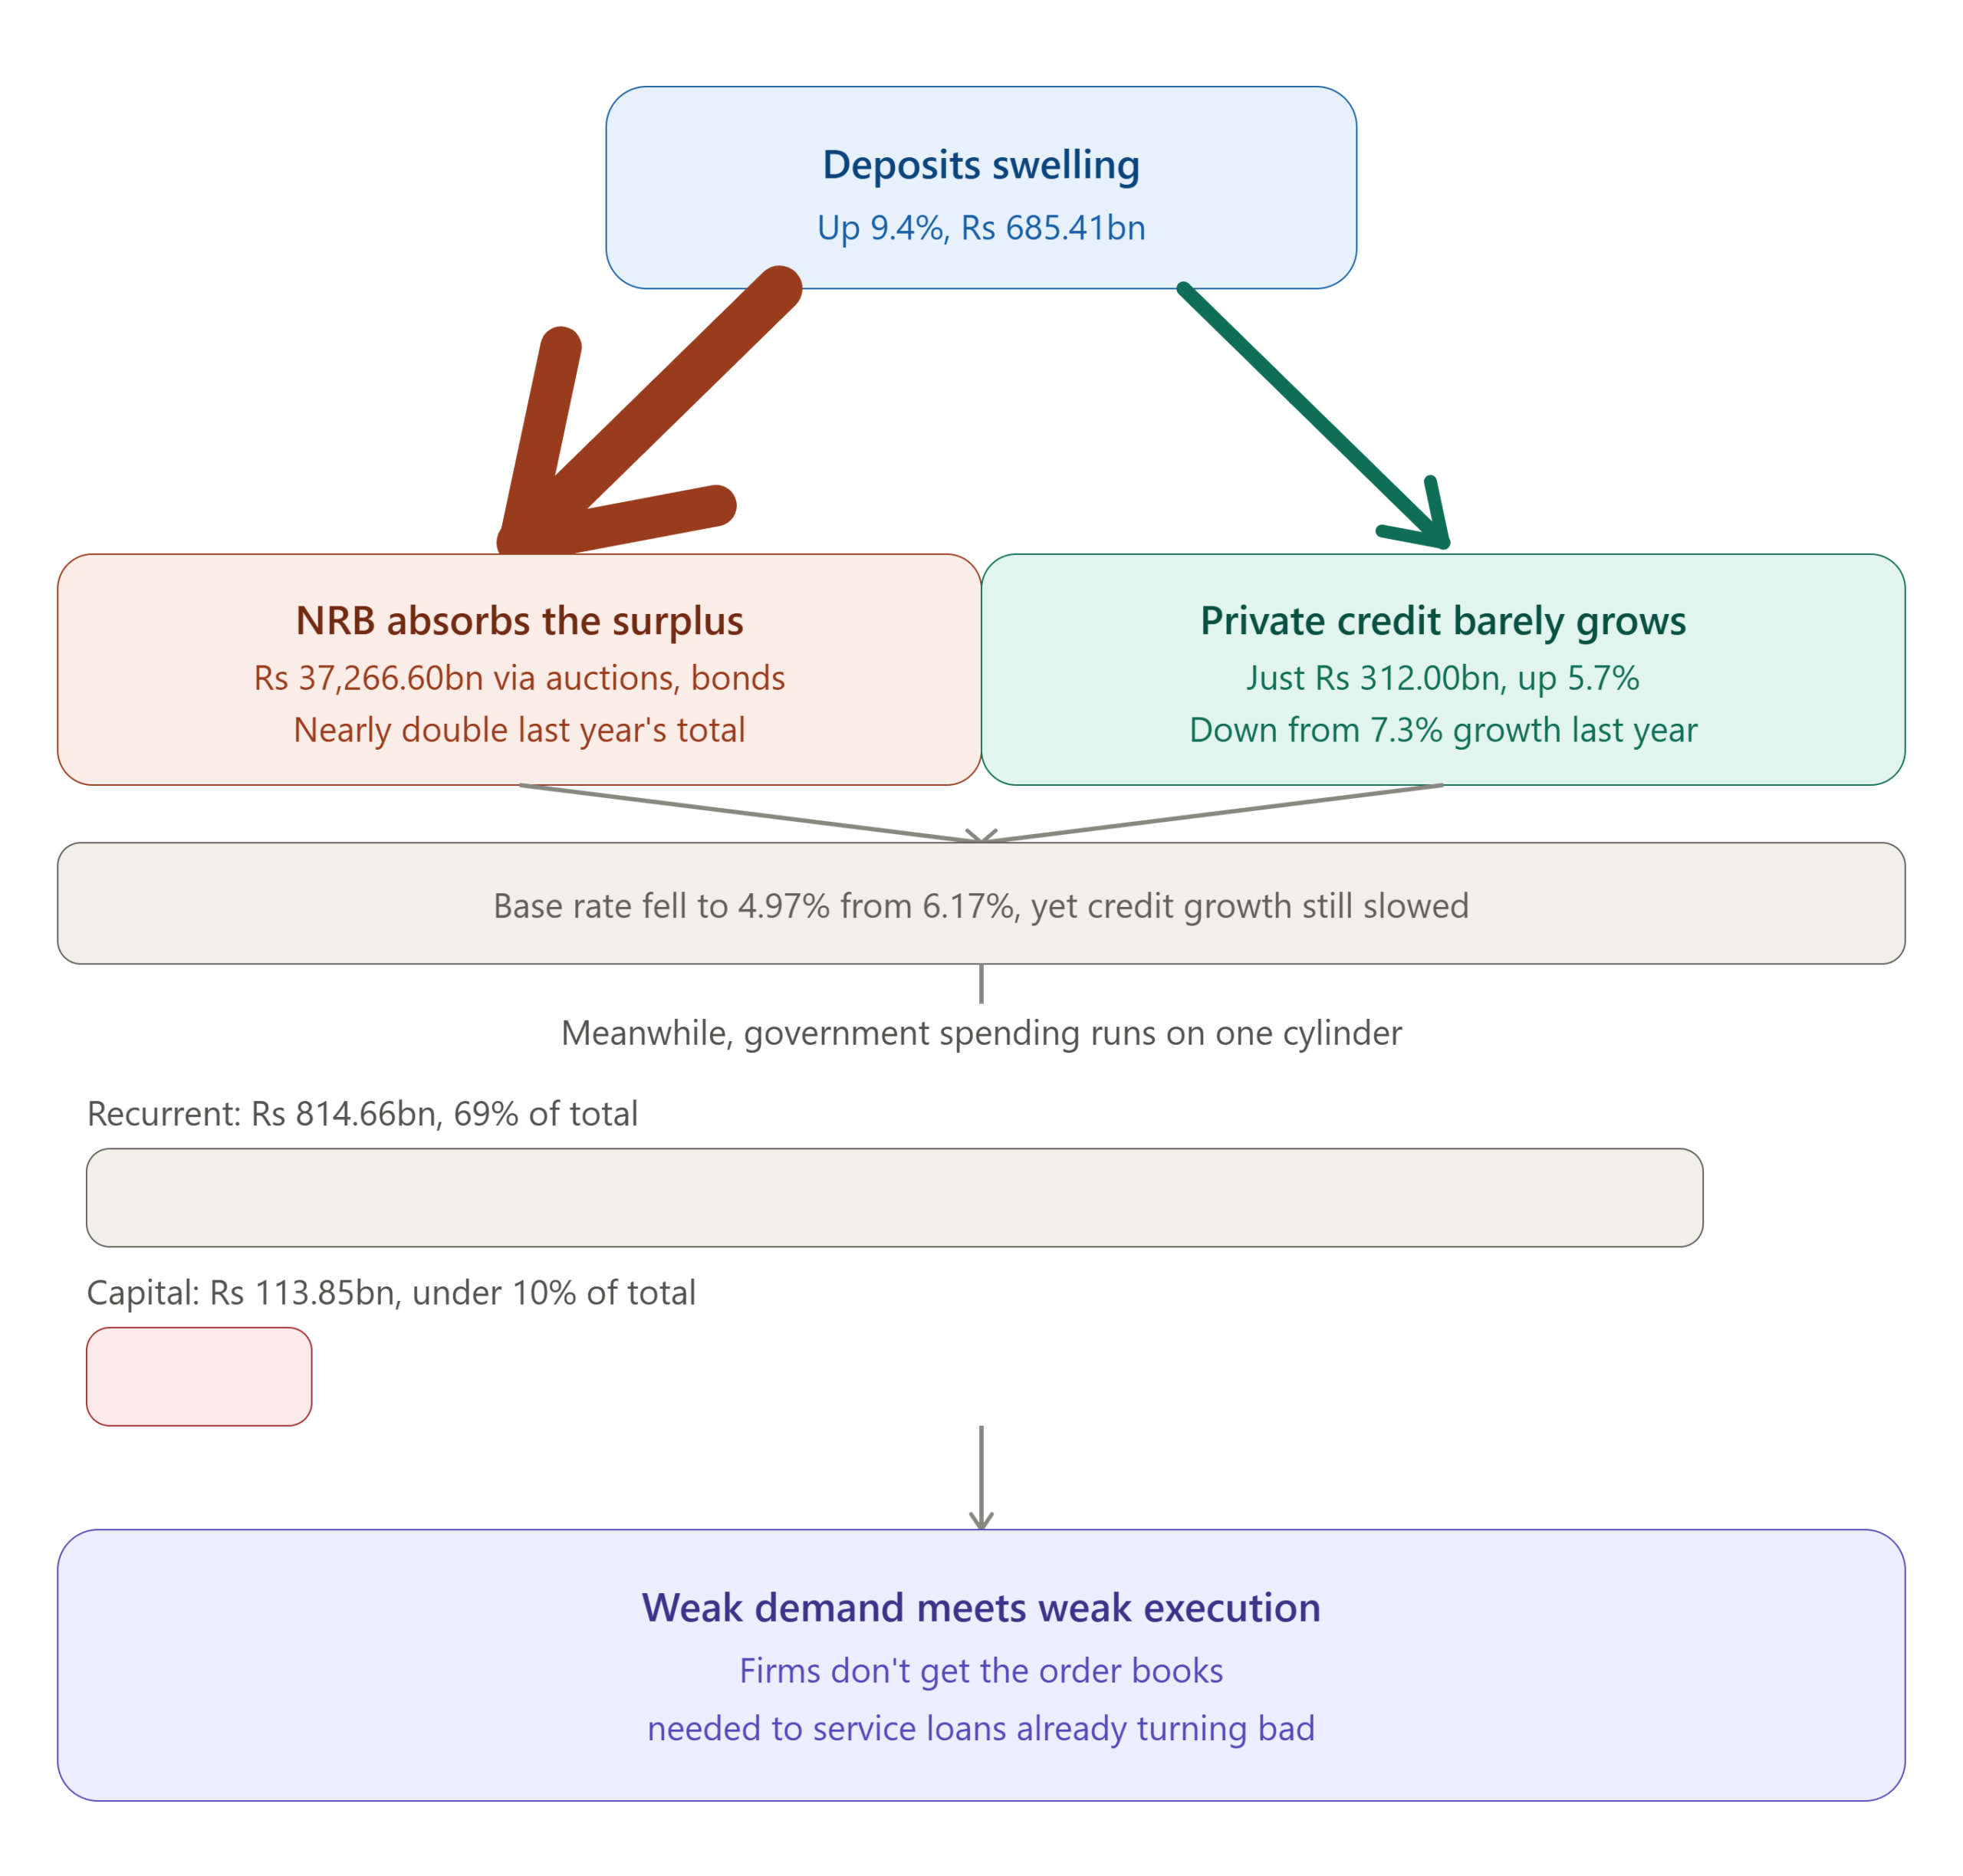
A banking system flush with deposits, facing weak private credit demand, sitting alongside a government that persistently underspends its own capital budget, is a textbook description of an economy where monetary policy alone cannot fix what is fundamentally a demand and execution problem. Lower interest rates — and the average base rate of commercial banks has indeed fallen sharply, to 4.97 percent by the tenth month of fiscal year 2025/26 from 6.17 percent a year earlier — have not been sufficient to reverse the credit growth slowdown, which is itself a signal that the binding constraint is not the cost of credit but borrowers’ willingness and capacity to take on more of it.
The FATF grey-listing: a second, distinct fault line running in parallel
It would be a mistake to fold Nepal’s February 2025 placement on the FATF “Increased Monitoring” list into the same causal story as the NPL trend — the two are analytically separate. FATF grey-listing concerns anti-money-laundering and counter-terrorism-financing controls, not loan underwriting quality. But the two vulnerabilities share a common effect: both raise the cost and friction of doing financial business in and with Nepal at the same time.
Grey-listing typically increases due-diligence burdens and costs for correspondent banking relationships — the international bank-to-bank links Nepali banks depend on for trade finance, remittance processing and cross-border settlement. This is Nepal’s second time on this list, having previously been listed from 2008 to 2014, and the government has responded with a new Asset (Money) Laundering Prevention Rules package and a fresh 2024/25-2028/29 national AML/CFT strategy.
AI generated photo
Assessing the overall financial-system resilience, the honest framing is that Nepal is currently managing two distinct reputational and operational risk vectors simultaneously — domestic credit quality and international compliance standing — at a moment when neither can be described as fully resolved, even if neither individually threatens acute systemic failure.
What this adds up to, in plain fiscal terms
Strip away both the reassuring framing of the executive summary and the alarmist framing an unbalanced reading might invite, and what remains is a system under genuine, multi-year, structural strain in one specific dimension — asset quality — while remaining adequately buffered in the others NRB tracks: capital, liquidity, leverage. That is not a contradiction; it is what a slow-building credit-quality problem looks like in its middle stage, before it either stabilises through economic recovery and better underwriting, or compounds into a broader capital and confidence problem through the exact transmission channel NRB’s own stress tests describe: rising NPLs forcing higher provisioning, compressing capital, and reducing banks’ shock-absorption capacity precisely when the economy can least afford tighter credit conditions.
The single most important forward-looking signal in the entire report is arguably the asset-quality sub-index within the Banking Stability Indicator, which rose from 0.71 to 0.89 in a single year — the sharpest one-year deterioration among all six components NRB tracks, and now the single highest-risk reading in the entire index. Everything else in this report — the sectoral NPL breakdown, the loss-category migration, the blacklisting curve, the stress-test outcomes under moderate credit shocks — is essentially different evidence converging on that same conclusion.
Nepal’s banking system is not in crisis today, by NRB’s own careful and calibrated language. But the fault line the central bank itself has identified is unambiguous, well-documented across a hundred-plus pages of its own data, and has been widening for three consecutive years without reversal.
For a system NRB describes as “broadly resilient,” the honest fiscal reading is that resilience currently rests on capital and liquidity buffers built during better years, being drawn down — slowly, but consistently — by a loan-quality problem the report’s own numbers say has not yet found its floor.