Kathmandu
Thursday, July 23, 2026





Public Debt Management Office data for the year ending mid-July 2026 show total public debt reaching 45.07 percent of GDP, as external borrowing fell far short of its annual target even while domestic borrowing nearly hit its mark.
KATHMANDU: The Public Debt Management Office has published its report on Nepal’s outstanding debt for the fiscal year from July 17, 2025 to July 16, 2026, offering a detailed account of how much the government owed, borrowed and repaid over the year, how currency movements affected the rupee value of foreign loans, and how actual borrowing and debt servicing compared with government targets.
Nepal’s public debt reached Rs 2.975 trillion by July 16, 2026, rising by Rs 300.85 billion, or 11.25 percent. But fresh borrowing was not the only driver: exchange-rate losses caused by the rupee’s depreciation against foreign currencies added nearly Rs 167 billion, accounting for 55.51 percent of the increase, while net new borrowing contributed Rs 133.85 billion. The debt stock now equals 45.07 percent of Nepal’s GDP.
How much public debt did Nepal owe at the close of the fiscal year 2025/26 that ended in mid-July 2026?
Nepal’s total public debt stood at Rs 2.975 trillion, precisely Rs 2,974,901,500,000, as of July 16, 2026, the last day of the fiscal year that began on July 17, 2025. At the very start of that fiscal year, total debt stood at Rs 2.674 trillion. Over the twelve months in between, the debt stock grew by roughly Rs 300.85 billion, an increase of about 11.25 percent.

Representative image
Using an approximate market exchange rate of Rs 154.5 to the US dollar, which was roughly where the rupee stood in the final week of July 2026, this closing debt figure converts to about USD 19.3 billion, up from around USD 17.3 billion a year earlier. That dollar figure is only an illustrative conversion using a single reference rate, since the report itself is denominated entirely in rupees and Nepal’s foreign loans sit in several different currencies that each move differently against the rupee.
What share of Nepal’s economy does this debt represent, and is that a cause for concern?
The report places total public debt at 45.07 percent of gross domestic product as of mid-July 2026, calculated against provisional national accounts figures the National Statistics Office released on April 28, 2026. A ratio in the mid-forties is generally viewed as moderate by the standards international lenders use for developing economies, most of which reserve serious alarm for ratios approaching 60 to 70 percent.
Based on this ratio, Nepal’s nominal GDP for the year works out to roughly Rs 6.6 trillion, or close to USD 42.7 billion at the same reference exchange rate, though this GDP figure is derived indirectly from the debt ratio the report provides rather than stated outright in the document.
What matters beyond the single year snapshot is direction: since debt grew by over 11 percent while the underlying economy grew far more slowly, the ratio has been drifting upward rather than sitting still, and repeated years of this pattern would eventually erode the comfortable cushion Nepal currently holds.
How is this debt split between money the government borrowed inside Nepal and money it owes to foreign lenders?
Of the total Rs 2.975 trillion owed at the close of the fiscal year, external debt made up Rs 1.599 trillion, or 53.77 percent of the total, while internal debt made up Rs 1.375 trillion, or 46.23 percent.
This continues a long standing pattern in which foreign lenders, chiefly multilateral development institutions and bilateral government creditors, hold a slightly larger share of Nepal’s total obligations than domestic banks, insurers, and individual investors who hold government securities.
IMF headquarters in Washington D.C.
At the start of the fiscal year, external debt stood at Rs 1.406 trillion against internal debt of Rs 1.268 trillion, meaning both categories expanded over the twelve months, though for very different reasons.
Did the government genuinely borrow much more this year, or does the increase mostly reflect currency movements?
Both forces were at work, but currency movements did the heavier lifting. Of the roughly Rs 300.85 billion increase in total debt, only about Rs 133.85 billion came from actual net new borrowing, meaning new loans received minus principal that was repaid, a figure the report labels net debt mobilization. That accounts for 44.49 percent of the total increase.
The remaining 55.51 percent, close to Rs 167 billion, came from exchange rate losses: the rupee weakened against the currencies in which Nepal’s foreign loans are held, so the same foreign currency debt translated into more rupees without a single additional loan being signed.
1672397318.jpg)
This currency effect alone added about 6.24 percent to the debt stock Nepal held at the start of the year, a reminder that a large share of this year’s reported debt growth reflects currency depreciation rather than fresh government borrowing decisions.
How much new borrowing had the government planned for the year, and how much did it actually raise?
The government’s annual target for total public debt mobilization for the fiscal year was Rs 595.66 billion. By July 16, 2026, actual receipts had reached Rs 447.17 billion, equal to 75.07 percent of that target, leaving Rs 148.49 billion of planned borrowing unmet. This overall 75.07 percent achievement rate looks reasonably solid at first glance, but it masks a sharp divergence between how well domestic and external borrowing plans were executed, which the next answer explains in detail.
In broad terms, it shows a government that came close to meeting its total borrowing needs for the year mainly because domestic financial markets absorbed government securities almost exactly as planned, compensating for a foreign financing shortfall that was, on its own, quite severe.
Why did domestic borrowing nearly meet its target while foreign borrowing fell so far short?
Domestic borrowing reached Rs 358.67 billion against an annual target of Rs 362.00 billion, a 99.08 percent achievement rate that shows the government almost fully executed its plan to issue treasury bills, development bonds, and similar instruments to domestic investors.
Foreign borrowing performed very differently: against a target of Rs 233.66 billion, only Rs 88.50 billion actually arrived, an achievement rate of just 37.88 percent, meaning foreign lenders disbursed less than four out of every ten rupees the government had planned to draw from them.
Typical explanations for such gaps in Nepal’s context include delays in getting foreign funded projects through procurement and implementation stages that trigger loan disbursement, along with the pace at which donor agencies process and release approved funding tranches, though this particular report does not name specific projects or reasons behind the shortfall.
How much did Nepal spend servicing its debt over the year, and did that match the budget?
Total spending on debt servicing, covering both principal and interest across domestic and external debt combined, reached Rs 386.23 billion against a revised annual budget of Rs 411.01 billion, a 93.97 percent execution rate. This total debt servicing bill equaled 5.85 percent of GDP for the year.
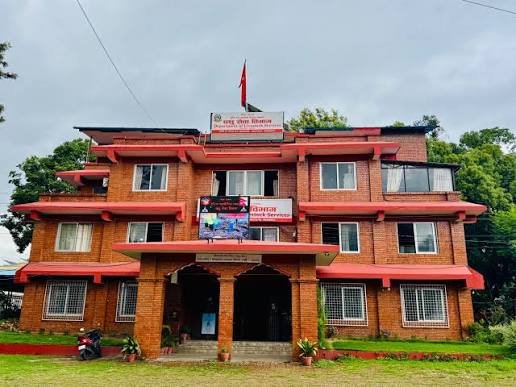
Public Debt Management Office, Tripureshwar. File photo
Domestic debt servicing came to Rs 311.94 billion against a budget of Rs 343.56 billion, a 90.80 percent execution rate, while external debt servicing came to Rs 74.29 billion against a budget of Rs 77.07 billion, a stronger 96.38 percent execution rate.
The higher execution rate on external servicing suggests that scheduled foreign loan repayments, which typically follow fixed repayment schedules agreed at the time of borrowing, were honored close to plan, while some domestic interest obligations lagged further behind budget than domestic principal repayments did.
How was the debt servicing bill split between principal and interest, and what does that split reveal?
Nepal’s total principal repayment for the year came to Rs 312.40 billion against a budget of Rs 313.46 billion, a near complete execution rate of 99.66 percent. Interest payments told a different story, reaching just Rs 73.82 billion against a budgeted Rs 97.56 billion, an execution rate of only 75.67 percent, leaving about Rs 23.73 billion of budgeted interest unpaid by year end.
Domestic interest payments were the main driver of this shortfall, executed at just 73.65 percent of budget, coming to Rs 61.38 billion against a planned Rs 83.34 billion.
Since principal repayment follows fixed loan amortization schedules that are difficult to defer, while interest payment timing appears to carry more flexibility, this gap between near complete principal execution and partial interest execution stands out as one of the more distinctive patterns in the year’s debt servicing figures.
What is “net debt mobilization” and how much of it took place this year?
Net debt mobilization measures the genuine increase in the government’s debt burden coming purely from new borrowing exceeding principal repayment, with currency effects stripped out. For the fiscal year, net debt mobilization totaled Rs 133.85 billion, made up of Rs 107.19 billion in net domestic borrowing and Rs 26.66 billion in net external borrowing.
On the domestic side, because there is no currency risk involved, the entire domestic debt increase of Rs 107.19 billion counted as net mobilization, effectively 100 percent.
Had exchange rates stayed completely flat through the year, Nepal’s external debt would have grown only modestly, and total public debt growth for the year would have been closer to Rs 133.85 billion rather than Rs 300.85 billion.
On the external side, only Rs 26.66 billion of the roughly Rs 193.66 billion increase in external debt came from net mobilization, just 13.77 percent, with the remaining 86.23 percent traced to exchange rate losses. This confirms that almost all of the deliberate, borrowing-driven increase in Nepal’s debt this year came from domestic sources rather than abroad.
Exactly how did the weaker rupee affect the external debt figures?
The report attributes an increase of roughly Rs 167 billion in Nepal’s external debt stock this year to currency depreciation, meaning the rupee weakened against the mix of foreign currencies in which Nepal’s loans are held. This single currency effect was more than six times larger than the entire net new external borrowing for the year, which came to only Rs 26.66 billion.
Had exchange rates stayed completely flat through the year, Nepal’s external debt would have grown only modestly, and total public debt growth for the year would have been closer to Rs 133.85 billion rather than Rs 300.85 billion.
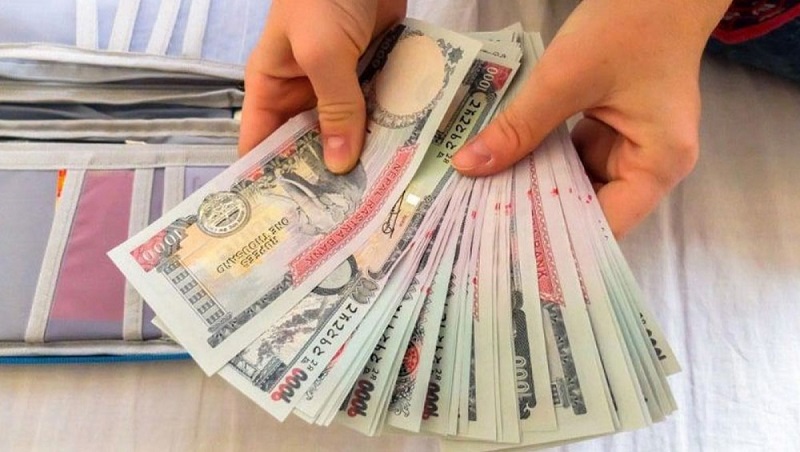
This distinction is important for anyone judging Nepal’s fiscal discipline from this report, since the headline debt growth figure considerably overstates how much actual government borrowing decisions, as opposed to currency market movements, drove the increase.
What do the monthly figures show about the pace of borrowing and repayment through the year?
The report’s monthly breakdown covers the twelve months from mid-July 2025 through mid-July 2026. Domestic debt receipts were fairly steady across the year, generally ranging between roughly Rs 15 billion and Rs 40 billion a month, with the months corresponding to mid-July to mid-August 2025, mid-December 2025 to mid-January 2026, mid-March to mid-April 2026, and mid-May to mid-June 2026 each recording around Rs 40 billion in domestic issuance, the highest monthly figures of the year.
External debt receipts were far less even, spiking to close to Rs 19.25 billion in the month running roughly from mid-February to mid-March 2026, the year’s strongest month for foreign disbursement, while other months saw external receipts fall below Rs 3.5 billion.
Domestic principal repayments were similarly uneven, jumping to close to Rs 44 billion in the month around mid-June to mid-July 2026, the largest single month, while two other months recorded no domestic principal repayment at all.
What is the promissory note or IMF related item that appears within the internal debt figures?
Within the internal debt liability data, a separate and much smaller line item labeled as promissory notes, tied to an IMF value adjustment, is tracked alongside the main body of domestic debt. This item started the fiscal year at about Rs 5.16 billion and, after a payment of roughly Rs 0.91 billion during the year with no new amounts added, closed at about Rs 4.25 billion.
Nepal’s closing public debt of Rs 2.975 trillion converts to about USD 19.3 billion, up from roughly USD 17.3 billion at the start of the fiscal year using the same reference point.
A footnote in the report clarifies that whatever amount was paid toward this IMF related adjustment has already been subtracted from the outstanding internal debt figures shown in the main tables.
This is a technical accounting item connected to Nepal’s financial arrangements with the International Monetary Fund, and although it is tiny relative to overall debt, its presence shows that Nepal’s domestic debt classification includes obligations tied to international financial institution arrangements, not solely government securities held by banks and the public.
How does Nepal’s debt look when expressed in US dollars and why does that framing matter?
Using an approximate reference rate of Rs 154.5 to the US dollar, roughly where the currency traded in the final week of July 2026, Nepal’s closing public debt of Rs 2.975 trillion converts to about USD 19.3 billion, up from roughly USD 17.3 billion at the start of the fiscal year using the same reference point.
This conversion is illustrative rather than official, since Nepal’s external debt portfolio is spread across multiple currencies, including special drawing rights, US dollars, Japanese yen, and others held by different multilateral and bilateral creditors, each of which moves independently against the rupee.
The dollar framing is useful mainly because it makes clear why currency depreciation carries real weight for Nepal’s finances: a weaker rupee mechanically raises the rupee cost of servicing and eventually repaying foreign currency loans, even when the underlying dollar or yen value of that debt has not changed at all.
Did Nepal’s debt grow faster than the size of its economy this year?
Total debt grew by about 11.25 percent over the fiscal year, and the debt to GDP ratio stood at 45.07 percent by the close of the year. The report does not itself state what the ratio was exactly one year earlier, so the precise year on year change in the ratio cannot be confirmed from this document alone.

However, since debt expanded by over 11 percent while Nepal’s nominal economic growth for the same period was considerably more modest based on standard estimates for the country, the broader direction is that debt has been growing somewhat faster than the size of the economy underpinning it this year.
This is consistent with the picture painted throughout this report of both a genuine, if modest, rise in domestic borrowing and a much larger currency driven inflation of the external debt figures.
What should readers watch for as Nepal enters the fiscal year that began on July 17, 2026?
The new fiscal year, covering July 2026 through mid-July 2027, opened on July 17, 2026. Heading into this period, the most important trends to track from this report are whether external debt disbursement improves from this year’s steep 37.88 percent shortfall against target, whether the rupee stabilizes against major foreign currencies to reduce the kind of currency driven debt increase seen this year, and whether interest payment execution catches up to the near complete rate seen in principal repayment.
The Public Debt Management Office typically issues updated monthly reports, so anyone following Nepal’s fiscal position closely can expect fresh figures covering the opening months of the new fiscal year within the coming months, which will show whether the patterns identified here, especially the heavy reliance on domestic borrowing and the outsized role of currency movements in external debt, persist or begin to shift.