Kathmandu
Sunday, July 12, 2026





A youthful new parliament must use data to understand constituencies, publish transparent baselines, and turn voter expectations into measurable development outcomes

The March 5 House of Representatives election has returned a new cohort of MPs. Those who have entered Singha Durbar with fresh resolve may be uncertain about where to begin. Some more experienced MPs will likely be thinking of continuing unfinished work from before. The new ones will probably be absorbed in studying and researching. The majority who have entered the House are first-time MPs, and the number of young members is significant – 93 of the 275 members are under 40.
The role of an MP is often reduced to lawmaking alone, but in Nepal’s context, that is insufficient. MPs carry certain constitutional responsibilities around policy and legislation, but their accountability to the voters who elected them weighs even more heavily. MPs function especially as champions of infrastructure development and social reform. New MPs must therefore work as hard to build their constituencies as they do to build the nation. To do that, they first need to understand their constituencies – the geographical, social, demographic, economic, and educational indicators that define them. If they are to bring genuine improvement to constituents’ lives during their term, MPs would do well to assess the full situation of their constituencies and release that assessment to the public in the form of a white paper.
This parliament is the youngest in history, driven by the dominance of young MPs. MPs engaged in the great mission of nation-building would do well to first look at the current picture of their constituencies, share what they see with their voters as a white paper, and then, after working every day to move their constituencies forward, return to the electorate five years later with a new white paper showing what has changed.
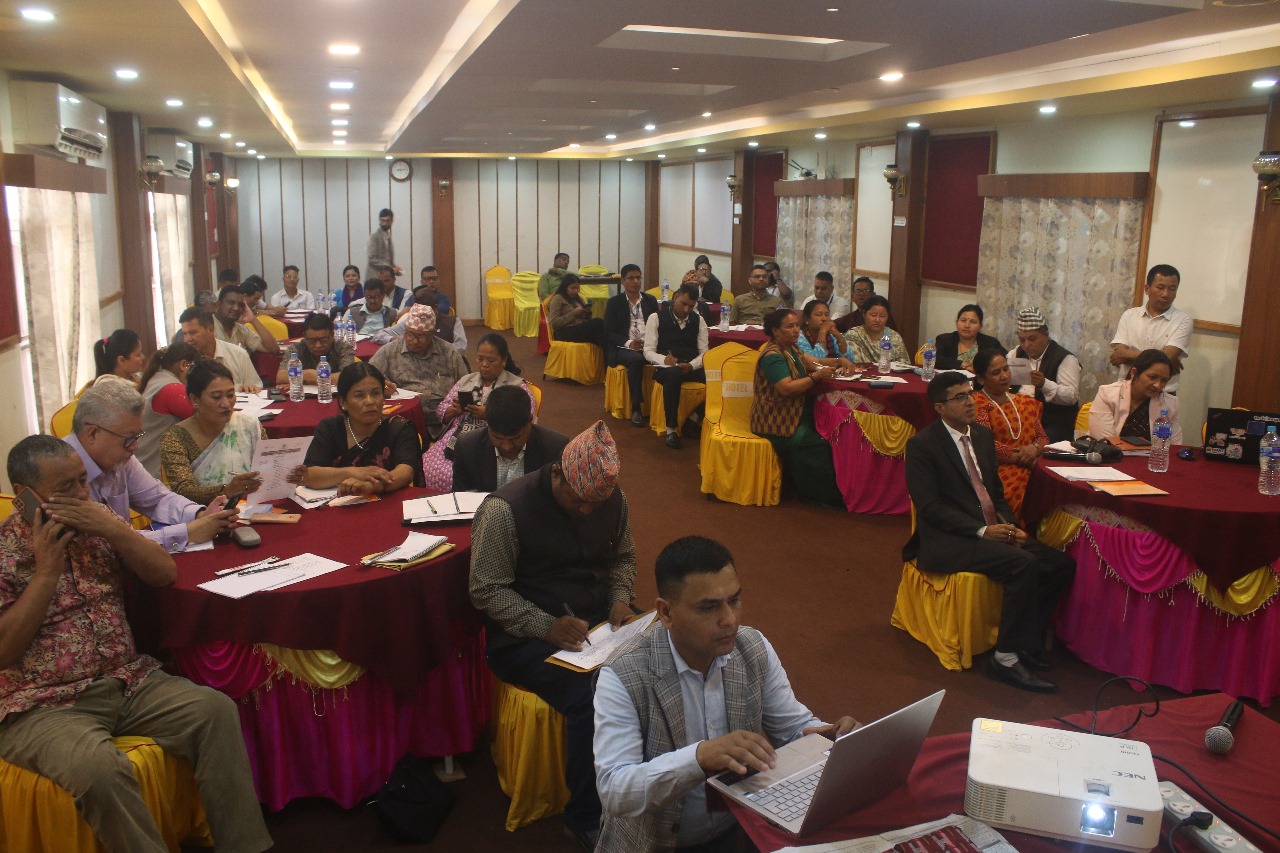
This election has returned new parties and new candidates in most places. Seats formerly held by Nepali Congress, UML, and the then-Maoist Center have this time been won by new forces such as RSP and Shram Sanskriti Party. Yet the voters and the people of those constituencies are the same. Those voters chose to believe the new parties over the old ones and gave them their mandate with greater hope. MPs now face both the challenge and the opportunity of turning those hopes into reality.
Planning on the basis of data
Terms such as data for development, evidence-based policy and planning, and evidence-based development have recently become prevalent in development and planning discourse. All of these terms demand data. Data reveals reality, and when reality is known, sound plans can be made. Plans built on guesswork fail; plans built on data are far more likely to succeed.
Data matters not only for development but for good governance too, and its importance in governance is not a new discovery. The debate took place in the United States Congress nearly 150 years ago. When a census bill was tabled in Congress in 1879 as a primary source of data, Congressman Cox spoke in its favor, saying that good governance cannot be maintained in a country without a census. And in 1858, Senatorial Candidate Abraham Lincoln, who became America’s President in 1861, remarked on the importance of data and the census: “If we could first know where we are, and whither we are tending, we could then better judge what to do, and how to do it.”
This shows that senior state officials in the United States nearly 150 years ago already saw the need for data in policy, planning, and development. Nepal’s policymakers, however, have yet to look at policy, planning, and development through a data lens consistently. While the National Planning Commission, ministries, and similar bodies do make some use of data in their plans, it is routinely ignored at the political level. The failure to use data from censuses and surveys conducted at a cost of billions of rupees to build plans is evidence of this. There is hope that the newly elected MPs will break that pattern and move forward with data-based planning.
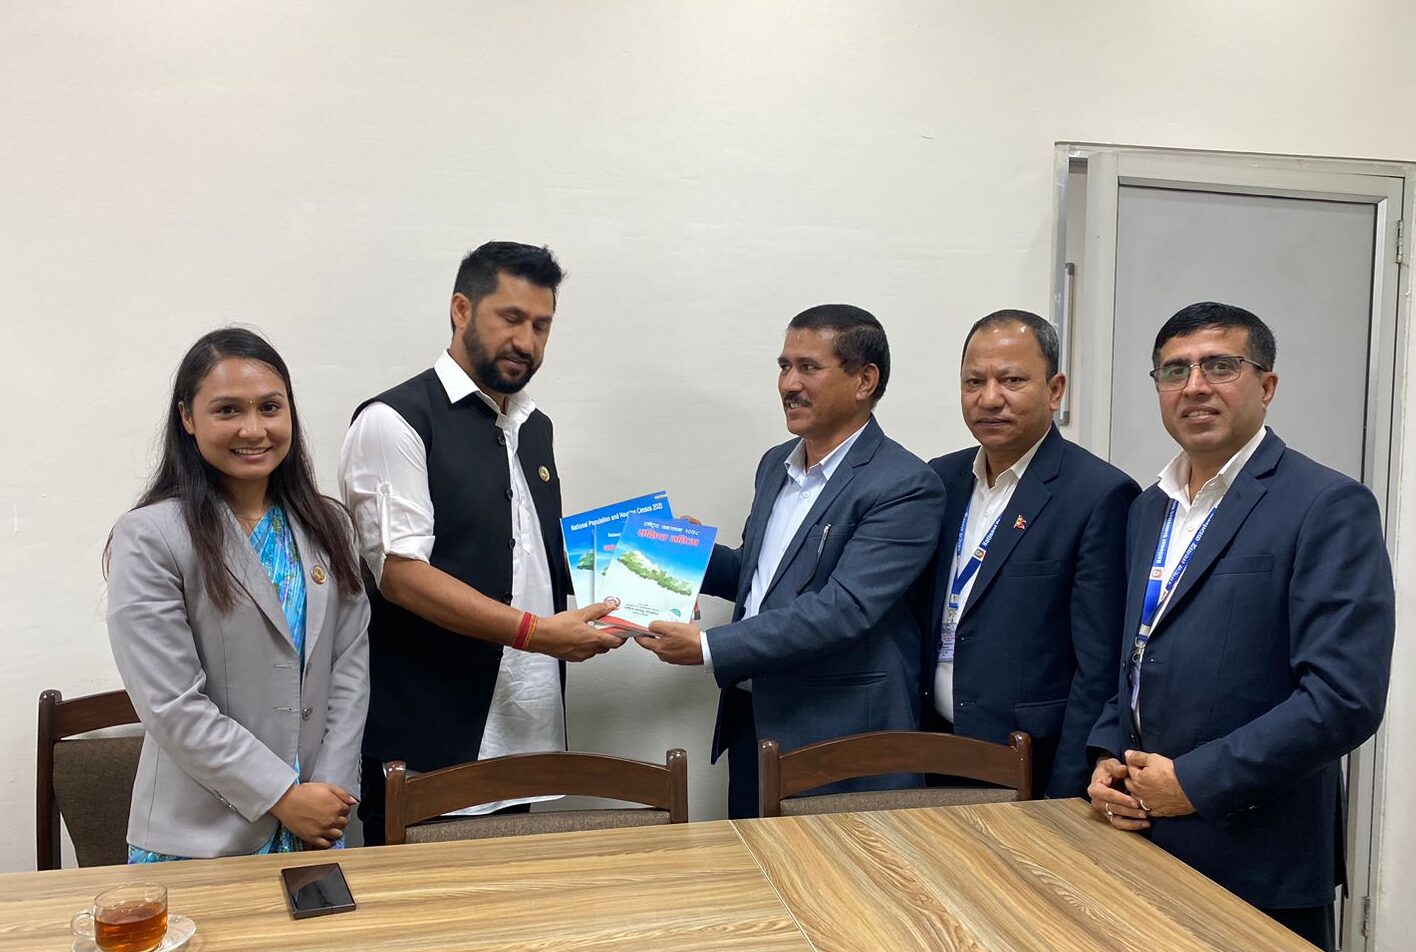
Statistics is not merely a number; it is a portrait of society. Data does nothing more than express that social portrait in numerical form. Young MPs should therefore consult data when making policy, formulating plans, and setting budgets from within government. That should begin with their own constituencies. Understanding the picture of one’s constituency makes it easier to determine where improvement should start, and to that end, some data-based analysis by constituency is presented here.
Constituencies with high and low populations
Nepal’s population is not evenly distributed. People are scattered across all 165 constituencies – some densely, some sparsely. Under Article 286 of the constitution, population is the primary basis for determining constituency boundaries, and constituencies have been drawn accordingly. As with districts, population distribution across constituencies is uneven.
According to the National Census 2021, the constituency with the highest number of households and population is Kathmandu-2, home to 71,829 households and a population of 268,169. The second most populous constituency is Rupandehi-2, with 67,837 households and a population of 265,203.
Among the 10 most populous constituencies, four are in the Kathmandu Valley; in the Terai region, two are in Chitwan, two in Sunsari, and one each in Bardiya and Kapilvastu. Among the more populous hill constituencies are two in Surkhet and one in Baitadi. Baitadi, despite having a population of over 235,000, has only a single constituency.
| Federal Election Constituency | Number of Households | Total Population | Male | Female | % |
| Nepal | 6,666,937 | 29,164,578 | 14,253,551 | 14,911,027 | 100 |
| Top 10 Highest Populated Constituencies | |||||
| Kathmandu (No. 2) | 71,829 | 268,169 | 136,222 | 131,947 | 0.9 |
| Rupandehi (No. 2) | 67,837 | 264,203 | 129,582 | 134,621 | 0.9 |
| Bhaktapur (No. 2) | 67,885 | 262,085 | 132,579 | 129,506 | 0.9 |
| Chitwan (No. 2) | 66,030 | 262,055 | 131,537 | 130,518 | 0.9 |
| Sunsari (No. 2) | 60,118 | 257,264 | 124,004 | 133,260 | 0.9 |
| Lalitpur (No. 3) | 64,697 | 250,810 | 125,747 | 125,063 | 0.9 |
| Bardiya (No. 1) | 56,637 | 245,249 | 116,524 | 128,725 | 0.8 |
| Surkhet (No. 2) | 56,935 | 243,676 | 120,326 | 123,350 | 0.8 |
| Baitadi (No. 1) | 49,428 | 242,157 | 113,864 | 128,293 | 0.8 |
| Kapilvastu (No. 1) | 46,152 | 239,879 | 115,261 | 124,618 | 0.8 |
| Top 10 Lowest Populated Constituencies | |||||
| Manang (No. 1) | 1,572 | 5,658 | 3,192 | 2,466 | 0.0 |
| Mustang (No. 1) | 3,674 | 14,452 | 7,934 | 6,518 | 0.0 |
| Dolpa (No. 1) | 9,398 | 42,774 | 21,371 | 21,403 | 0.1 |
| Rasuwa (No. 1) | 11,140 | 46,689 | 24,035 | 22,654 | 0.2 |
| Humla (No. 1) | 11,228 | 55,394 | 27,886 | 27,508 | 0.2 |
| Rukum East (No. 1) | 12,886 | 56,786 | 27,516 | 29,270 | 0.2 |
| Mugu (No. 1) | 12,439 | 64,549 | 32,381 | 32,168 | 0.2 |
| Tehrathum (No. 1) | 21,857 | 88,731 | 43,581 | 45,150 | 0.3 |
| Lalitpur (No. 1) | 24,703 | 103,623 | 51,530 | 52,093 | 0.4 |
| Solukhumbu (No. 1) | 26,319 | 104,851 | 52,747 | 52,104 | 0.4 |
Low-population constituencies are mostly concentrated in the mountain and hill regions. Manang, with 1,572 households and a population of 5,658, is the least populous constituency, followed by Mustang, Dolpa, Rasuwa, and Humla. Interestingly, Lalitpur-1, within the Valley, ranks ninth among the least populous constituencies, with a population of 103,623.
Among the ten constituencies under the heaviest migration pressure, Bhaktapur-2 has recorded the highest population growth. While Nepal’s average population growth rate is 0.92 percent, this constituency’s rate stands at 4.56 percent. In the decade from 2011 to 2021, Nepal’s overall population grew by 10.1 percent, while Bhaktapur-2 saw growth of 60.8 percent. After Bhaktapur-2, population increased by 49 percent in Rupandehi-2, 45 percent in Kathmandu-2, 40.8 percent in Jhapa-2, and 37.6 percent in Kathmandu-7.
The constituency with the lowest population growth rate is Ramechhap. A single-constituency district, its population growth rate is negative at minus 1.67 percent, meaning 16 percent fewer people live there than a decade ago. Kathmandu-1 is also losing population, as people gradually migrate from dense urban areas to newly expanding urban zones. Centered on Baneswor, this constituency has shed a proportion similar to Ramechhap – 15.1 percent – over the decade. Most constituencies losing population are in the mid-hills.
| Federal Election Constituency | Total | Urban % | Semi-Urban % | Rural % | Federal Election Constituency | Total | Urban % | Semi-Urban % | Rural % |
| Nepal | 29,124,480 | 27.1 | 39.7 | 33.2 | |||||
| Top 10 Highest Urban % | Top 10 Lowest Urban % | ||||||||
| Kathmandu (No. 1) | 126,408 | 100 | 0 | 0 | Morang (No. 2) | 182,016 | 0 | 96.9 | 3.1 |
| Kathmandu (No. 4) | 214,894 | 100 | 0 | 0 | Rupandehi (No. 4) | 199,836 | 3.5 | 96.5 | 0 |
| Kathmandu (No. 8) | 145,555 | 100 | 0 | 0 | Siraha (No. 2) | 184,537 | 0 | 96.2 | 3.8 |
| Bhaktapur (No. 2) | 259,841 | 100 | 0 | 0 | Saptari (No. 4) | 171,782 | 0 | 95.0 | 5 |
| Lalitpur (No. 3) | 244,628 | 100 | 0 | 0 | Kapilvastu (No. 1) | 239,212 | 0 | 93.0 | 7 |
| Lalitpur (No. 2) | 196,854 | 99.5 | 0 | 0.5 | Mahottari (No. 2) | 178,753 | 7.9 | 92.1 | 0 |
| Kathmandu (No. 7) | 212,936 | 96.7 | 3.3 | 0 | Rupandehi (No. 5) | 218,097 | 2.9 | 91.9 | 5.3 |
| Kathmandu (No. 5) | 220,685 | 93.6 | 6.4 | 0 | Dhanusha (No. 2) | 213,979 | 8.2 | 91.8 | 0 |
| Kathmandu (No. 9) | 170,306 | 93.6 | 6.4 | 0 | Sarlahi (No. 4) | 220,087 | 8.7 | 91.3 | 0 |
| Kathmandu (No. 2) | 264,316 | 92.4 | 4.7 | 2.9 | Banke (No. 3) | 192,348 | 4 | 91.3 | 4.7 |
What kind of families live in each constituency?
According to the constituency-level demographic report prepared by the National Statistics Office on the basis of the 2021 census, 60.1 percent of families in Nepal are nuclear. The highest concentration of nuclear families is in constituencies in the mountain region. Six of the 10 leading constituencies in this regard are in the high-mountain zone – in Dolakha, for instance, 75.4 percent of families are nuclear. Sindhupalchok-1, Solukhumbu, Dolpa, Gorkha-1, and Rasuwa all have nuclear family rates above 65 percent. Kathmandu-7 and Kathmandu-6 are also constituencies with a predominance of nuclear families.
What policymakers must understand when formulating policy, programs, and budgets is that the needs, wishes, and priorities of nuclear and joint families are different.
| Federal Election Constituency | Number of Households | Federal Election Constituency | Avg. Household Size |
| Top 10 Highest Household Counts | Top 10 Largest Avg. Family Size | ||
| Nepal | 6,666,937 | Nepal | 4.37 |
| Kathmandu (No. 2) | 71,829 | Rautahat (No. 2) | 6.51 |
| Bhaktapur (No. 2) | 67,885 | Bara (No. 2) | 6.26 |
| Rupandehi (No. 2) | 67,837 | Parsa (No. 3) | 5.95 |
| Chitwan (No. 2) | 66,030 | Kapilvastu (No. 3) | 5.92 |
| Lalitpur (No. 3) | 64,697 | Rupandehi (No. 4) | 5.92 |
| Kathmandu (No. 6) | 62,509 | Rautahat (No. 3) | 5.91 |
| Kathmandu (No. 5) | 60,523 | Parsa (No. 2) | 5.85 |
| Sunsari (No. 2) | 60,118 | Bara (No. 3) | 5.83 |
| Jhapa (No. 5) | 59,364 | Rautahat (No. 1) | 5.81 |
| Chitwan (No. 3) | 59,274 | Parsa (No. 1) | 5.78 |
| Top 10 Lowest Household Counts | Top 10 Smallest Avg. Family Size | ||
| Manang (No. 1) | 1,572 | Gorkha (No. 2) | 3.49 |
| Mustang (No. 1) | 3,674 | Dolakha (No. 1) | 3.49 |
| Dolpa (No. 1) | 9,398 | Gorkha (No. 1) | 3.50 |
| Rasuwa (No. 1) | 11,140 | Lamjung (No. 1) | 3.53 |
| Humla (No. 1) | 11,228 | Tanahun (No. 1) | 3.55 |
| Mugu (No. 1) | 12,439 | Syangja (No. 1) | 3.56 |
| Rukum East (No. 1) | 12,886 | Manang (No. 1) | 3.60 |
| Tehrathum (No. 1) | 21,857 | Sindhupalchok (No. 1) | 3.60 |
| Achham (No. 1) | 23,818 | Kathmandu (No. 6) | 3.62 |
| Jumla (No. 1) | 24,438 | Parbat (No. 1) | 3.62 |
Constituencies shaped by migration
As people migrate in search of new destinations, recent elections have become increasingly competitive. There are examples of people changing their political loyalties and views when they move from their original home to a new place. This is likely why urban and Terai areas with high in-migration show far greater electoral volatility than the hill districts that have traditionally served as party strongholds. For example, the Nepali Congress and the UML each won two of the four constituencies in the Mechi hill districts of Taplejung, Panchthar, and Ilam. But most voters who had left those districts for Jhapa in the Terai voted for a new party there, which is why RSP swept all five Jhapa constituencies.
| Federal Election Constituency | 2068 Population | 2078 Population | Annual Growth Rate (%) | Decadal Change |
| Top 10 Highest Growth Rates | ||||
| Nepal | 26,494,504 | 29,164,578 | 0.92 | 10.1 |
| Bhaktapur (No. 2) | 162,987 | 262,085 | 4.56 | 60.8 |
| Rupandehi (No. 2) | 177,798 | 264,203 | 3.83 | 49.0 |
| Kathmandu (No. 2) | 184,823 | 268,169 | 3.57 | 45.1 |
| Jhapa (No. 2) | 166,383 | 234,268 | 3.28 | 40.8 |
| Kathmandu (No. 7) | 155,809 | 214,401 | 3.06 | 37.6 |
| Kaski (No. 2) | 158,392 | 211,974 | 2.80 | 33.8 |
| Kailali (No. 5) | 160,922 | 211,713 | 2.63 | 31.6 |
| Surkhet (No. 2) | 185,713 | 243,676 | 2.61 | 31.2 |
| Lalitpur (No. 2) | 151,599 | 197,234 | 2.53 | 30.1 |
| Morang (No. 3) | 164,282 | 212,360 | 2.46 | 29.3 |
| Top 10 Lowest Growth Rates | ||||
| Ramechhap (No. 1) | 202,646 | 170,302 | -1.67 | -16.0 |
| Kathmandu (No. 1) | 163,354 | 138,686 | -1.57 | -15.1 |
| Khotang (No. 1) | 206,312 | 175,298 | -1.56 | -15.0 |
| Achham (No. 1) | 126,669 | 107,673 | -1.56 | -15.0 |
| Syangja (No. 1) | 141,890 | 122,009 | -1.45 | -14.0 |
| Manang (No. 1) | 6,538 | 5,658 | -1.39 | -13.5 |
| Bhojpur (No. 1) | 182,459 | 157,923 | -1.39 | -13.4 |
| Gulmi (No. 1) | 145,295 | 126,546 | -1.33 | -12.9 |
| Tehrathum (No. 1) | 101,577 | 88,731 | -1.30 | -12.6 |
| Kavrepalanchok (No. 1) | 183,182 | 161,114 | -1.23 | -12.0 |
Migration-driven population shifts also cause the number of constituencies in different geographical areas to fluctuate. Under constitutional provisions, constituencies must be redrawn every 20 years on the basis of the previous census, meaning that population changes alter the geographic distribution of constituencies.
According to the latest census, 69 percent of Nepalis live in the place where they were born. Thirty-one percent have left their original home – 19 percent were born in a different district and 9 percent in a different municipality. Under the administrative definition, a person who has moved from one ward to another is classified as a migrant. Of the 10 constituencies with the highest in-migration, all except Rupandehi-2 are in the Kathmandu Valley. The highest-migration constituencies are Kathmandu-1, 2, 6, 4, 3, 5, and Bhaktapur-2, with migrant populations of 63.5, 61, 60.6, 59.7, 59, and 58.2 percent respectively.
Constituencies with very low out-migration are heavily concentrated in Karnali. Of the 10 constituencies where the population has largely stayed in its original home, eight are in Karnali Province, one in Lumbini, and one in Sudurpashchim. The most demographically stable – where people remain almost entirely in their ancestral home – are Rukum East and Rolpa in Lumbini Province. In Rukum East, 93.4 percent of people live in the same municipality where they were born; in Rolpa, the figure is 93.2 percent. In Karnali’s Jajarkot, Mugu, Dolpa, Dailekh-1, Dailekh-2, Humla, and Rukum West, the proportions living in their place of birth are 93.4, 93.3, 93.1, 92.4, 89.8, and 89.6 percent respectively. In Bajura in Sudurpashchim, 92.4 percent of people still live in the municipality of their birth. Annual population growth rates in all these districts are positive, with the exception of Dailekh, which registers minus 0.3 percent.
Constituencies economically: Which are strong, which are weak?
A constituency’s strengths and weaknesses depend on the composition of its population. Those who engage in income-earning work for six months or more are classified as economically active; those who earn for less than six months are economically inactive. In Nepal, 41 percent of people above the age of 10 are economically active, while 29.6 percent earn income for less than six months.
Seven of the 10 districts with the highest concentration of economically inactive population are in Madhesh Province, with one each from Karnali, Lumbini, and Sudurpashchim. Among the constituencies with the highest proportions of economically inactive population, Dolpa leads at 43.8 percent, followed by Mahottari-4 at 42.8, Gulmi-2 at 42.7, Mahottari-3 at 42.6, Baglung-2 at 41.7, Mahottari-2 at 40.3, and Baitadi at 39.4. Sarlahi-2 and Sarlahi-4 each stand at 39 percent, and Dhanusha-3 at 38.7 percent.
Constituencies with high proportions of economically active population tend to be in the mountain and hill regions. In single-constituency districts such as Manang, Khotang, Mustang, Sankhuwasabha, and Dhankuta, more than 60 percent of people are engaged in some form of income-earning work for more than six months.
Sanitation and permanent housing
Toilets, a basic sanitation indicator, are present in most Nepali homes. Nationally, 95.6 percent of households have a toilet and 4.5 percent do not. However, in some constituencies nearly a third of homes lack one. In Kapilvastu-3, 32.6 percent of households have no toilet; in Kapilvastu-2, the figure is 23.5 percent. Eight constituencies have toilet-absence rates above 16 percent, all in Madhesh Province – Parsa-3 at 20.5, Mahottari-4 at 20.1, Dhanusha-2 at 19.1, Saptari-3 at 19.1, Parsa-2 at 18.1, Rautahat-3 at 17.4, Mahottari-2 at 17.4, and Parsa-4 at 16.7 percent.
As with sanitation, Madhesh Province constituencies are also weakest in other physical infrastructure. Nationally, 7.8 percent of people live in mud-built homes, but in some Madhesh constituencies close to 60 percent of people live in such structures in unsafe conditions. In Sarlahi-4, which is the prominent constituency where Nepali Congress President Gagan Kumar Thapa was defeated, 57 percent of people live in mud homes. In Parsa-3, the figure is 54.8 percent; in Mahottari-4, 51.7 percent; and in Rautahat-3, 50 percent.
On the measure of permanent housing, Kaski outperforms even Kathmandu. According to the National Statistics Office report, 98.7 percent of people in Kaski-2, which falls within Pokhara Metropolitan City, live in permanent structures. Rupandehi-2 comes second at 98.4 percent. Kaski-1 follows at 98.3 percent, Kathmandu-8, Kathmandu-1, and Kaski-3 at 98 percent, and Parbat, Dhading-2, Syangja-2, and Nuwakot-2 each exceed 97 percent.
Literacy
Of those aged five and above, 76.2 percent of Nepal’s population is literate. But literacy rates vary considerably by constituency. Three constituencies have literacy rates above 90 percent – Kathmandu-1, Rupandehi-2, and Kathmandu-5, with rates of 92.9, 91.4, and 90.9 percent respectively – roughly 14 percentage points above the national average. The three constituencies with the lowest literacy rates are all in Madhesh Province, each below 56 percent.
The constituencies with the lowest literacy are Rautahat-2, Sarlahi-4, and Mahottari-2, with rates of 52.4, 54.7, and 55.4 percent respectively – nearly 21 percentage points below the national average. MPs from low-literacy constituencies should prioritize improving educational conditions and making their constituents literate above all else. As long as illiteracy predominates in a constituency, other indicators for that area are also likely to remain low. Low literacy is a marker of underdevelopment, and new MPs should bear in mind that constituency development may well begin with launching a campaign to make their areas fully literate.
| Federal Election Constituency | 5+ Population | Total Literacy | Male | Female | Federal Election Constituency | 5+ Population | Total Literacy | Male | Female |
| Top 10 Highest Literacy | Top 10 Lowest Literacy | ||||||||
| Kathmandu (No. 1) | 132,844 | 92.9 | 96.1 | 89.3 | Rautahat (No. 2) | 188,043 | 52.4 | 59.3 | 45.5 |
| Rupandehi (No. 2) | 248,072 | 91.4 | 95.4 | 87.6 | Sarlahi (No. 4) | 195,891 | 54.7 | 62.6 | 46.5 |
| Kathmandu (No. 5) | 212,624 | 90.9 | 95.3 | 86.4 | Mahottari (No. 4) | 163,429 | 55.4 | 63.7 | 47.2 |
| Kathmandu (No. 4) | 209,476 | 90.5 | 95.1 | 86.0 | Mahottari (No. 2) | 158,314 | 55.6 | 64.8 | 47.0 |
| Kathmandu (No. 6) | 212,935 | 90.1 | 94.8 | 85.4 | Rautahat (No. 3) | 185,162 | 57.8 | 66.8 | 48.7 |
| Lalitpur (No. 3) | 237,924 | 89.8 | 94.5 | 85.1 | Sarlahi (No. 2) | 192,263 | 58.5 | 66.6 | 50.1 |
| Lalitpur (No. 2) | 186,194 | 89.7 | 94.7 | 84.5 | Bara (No. 2) | 172,051 | 58.8 | 67.9 | 49.4 |
| Kaski (No. 2) | 197,069 | 89.5 | 94.6 | 84.5 | Rautahat (No. 1) | 168,814 | 59.3 | 68.1 | 50.4 |
| Bhaktapur (No. 2) | 245,101 | 89.4 | 94.9 | 83.8 | Dhanusha (No. 2) | 187,713 | 59.5 | 69.9 | 50.2 |
| Kathmandu (No. 7) | 202,318 | 89.4 | 93.9 | 84.8 | Dhanusha (No. 1) | 191,379 | 61.3 | 71.0 | 52.4 |
Where hill and Madhesi-Terai communities live
Looking at the ethnic composition of constituencies, hill communities are notably concentrated in some constituencies in Sudurpashchim and Karnali, while Madhesi-Terai communities are prominent in Madhesh Province. Interestingly, the concentration of hill communities in the hills of Sudurpashchim exceeds the concentration of Terai communities even in Madhesh. For example, Darchula – the constituency with the highest proportion of hill communities – has an 85.5 percent hill community population. By contrast, Sarlahi-4, the constituency with the highest proportion of Terai communities, stands at only 72.4 percent.
After Darchula, Bajhang has the second highest hill community population at 83.9 percent. Other constituencies with significant hill community populations include Jumla at 79, Baitadi at 78, and Achham-1 at 72.8 percent. Among Terai communities, Rupandehi-4 stands at 68.5, Rautahat-1 at 66.2, Dhanusha-3 at 65.5, and Sarlahi-2 also at 65.5 percent.
The figures cited above are not mere numbers; they are portraits of each constituency. They are also a record of what the MPs previously elected from those constituencies did and did not do. Some candidates may not have known the actual conditions of their constituency during the campaign. But once elected, an MP cannot afford to remain ignorant of such information. Only by understanding the demographic, social, and educational data of their constituency can MPs find the path to meaningful new work.
The promises and commitments MPs made to voters during the campaign are mostly about physical development. But alongside the physical, MPs carry the responsibility of improving the social conditions of every constituency. Some argue that an MP’s job is only to make laws. But in Nepal’s context, an MP is the central authority for their area – with the standing to direct budget allocations to their constituency and shape the plans that go into it. However, in orientating his MPs, RSP Chairman Rabi Lamichhane has instructed them not to be constituency-focused, on the reasoning that if the country is built, one’s constituency will be built along with it. Even so, every MP should at least look at the face of their constituency once and issue a white paper on what they find. The day when people can assess an MP’s work on the basis of that white paper will not be far. Let all 165 directly elected MPs compile at least 20 social indicators and issue a white paper. Let that be the starting point for building their constituencies – and in doing so, they will also be paving the way to building the nation.
How many people live in one’s constituency? What kinds of homes do they live in? What is the state of their education? Is the population predominantly indigenous or made up of migrants? These are things every elected MP must know. Evidence-based agenda-setting is the primary need of the day. For instance, the fact that roughly 33 percent of people in Kapilvastu-3 lack a toilet means that the MP’s primary agenda should be building a toilet in every home. Similarly, the primary task for the MP from Sarlahi-4 could be moving people out of mud-built and unsafe housing into secure shelter because 57 percent of people there live in mud homes.
Where to find the data?
The National Statistics Office conducts various surveys in addition to the census, which is held every 10 years. At least 22 thematic reports from the 12th National Census of 2021 have been made public. Among them, the constituency-level demographic report is a new addition – never before has a constituency-focused data report been released. This time, however, a 350-page report covering around 50 indicators was published last year.
This report will give MPs a data-based understanding of the constituency they have been elected from. Once they know the current situation – where things stand – setting a target for where they want to be becomes much easier.
Because policymakers in Nepal tend to neglect knowledge production, MPs sometimes cannot find the data they need even when they want it – whether figures on health insurance coverage, the number of patients with non-communicable diseases, households without access to drinking water, or citizens who do not pay taxes. Such data, which is central to formulating policy and programs, also needs to be kept up to date. US senators, for instance, have the facility to build research teams that produce precisely this kind of data. They hire at least one lead researcher and interns from universities as needed, and the research team’s job is to find the data senators require and conduct research themselves when necessary. Senators then speak in parliament and lobby for plans in their constituencies on the basis of that data. Most of their work is grounded in evidence.
The United Nations too holds the position that prosperity can only be achieved through the correct use of data. This is presumably why the UN Statistical Commission has adopted the slogan ‘Better Data, Better Lives’. In Nepal, the First Five-Year Plan was formulated on the basis of data from the 1952 -1954 census. Even that First Five-Year Plan (1956-1961) – a milestone in the beginning of planned development – noted limitations in available data. The Second Three-Year Plan (1962-1965) explicitly stated that it had been unable to address certain areas due to lack of data, acknowledging that some plans and programs were felt to be necessary but could not even be discussed for want of data. The Second Five-Year Plan document stated that the plan had been unable to address various sectors due to data deficiencies in those areas.
Times have changed. The data scarcity of the Second Three-Year Plan era no longer exists. Then, data could only be obtained from limited sources; now it can be obtained from unlimited ones. Small surveys can even be conducted digitally by MPs themselves. MPs therefore have the opportunity to draw on various sources, use data, and make objective choices about what policy, planning, and budgeting requires. If MPs cultivate the habit of seeking, asking for, and using data as the primary foundation of evidence-based development, that habit will transfer to the sectors below them – and data will begin to guide the country’s plans. So, honorable members, look at your constituency indicators once. Compile them into a white paper and use that same data to set your targets for the coming years. Five years from now, issue another white paper showing how much the face of your constituency has changed through your contribution.