Kathmandu
Wednesday, July 1, 2026


Nepal’s economy shows broad macroeconomic stability in the first nine months of FY 2025/26, with low inflation, record-high foreign reserves, a sharp rise in remittances, and strong external surpluses, even as trade deficit widens and investment spending remains modest.
KATHMANDU: Nepal Rastra Bank’s latest report on the first nine months of fiscal year 2025/26 (ending mid-April 2026) paints a picture of macroeconomic stability.
Inflation remains moderate at 4.47 percent year-on-year in mid-April, while average inflation for the period stands at a low 2.39 percent.
Gross foreign exchange reserves have reached Rs. 3,494.73 billion (USD 23.55 billion), sufficient for 18.4 months of merchandise and services imports.
Remittances surged 39.1 percent, supporting a healthy current account surplus of Rs. 618.68 billion and balance of payments surplus of Rs. 731.16 billion.
Both exports and imports grew, while government revenue and spending reflect ongoing fiscal activity.
What does the latest inflation data reveal about price trends in Nepal?
Consumer price inflation stood at 4.47 percent year-on-year in mid-April 2026, up from 3.39 percent a year earlier. Food and beverage inflation rose to 4.01 percent while non-food and services inflation reached 4.72 percent.
Average inflation for the nine months was comfortably low at 2.39 percent compared to 4.57 percent previously. Within food items, ghee & oil prices jumped 12.87 percent, fruits 11.67 percent, and vegetables 9.18 percent, though pulses, cereals, and spices saw modest declines.
Non-food categories showed notable increases in miscellaneous goods (19.94 percent), transportation (12.03 percent), and education (7.46 percent).
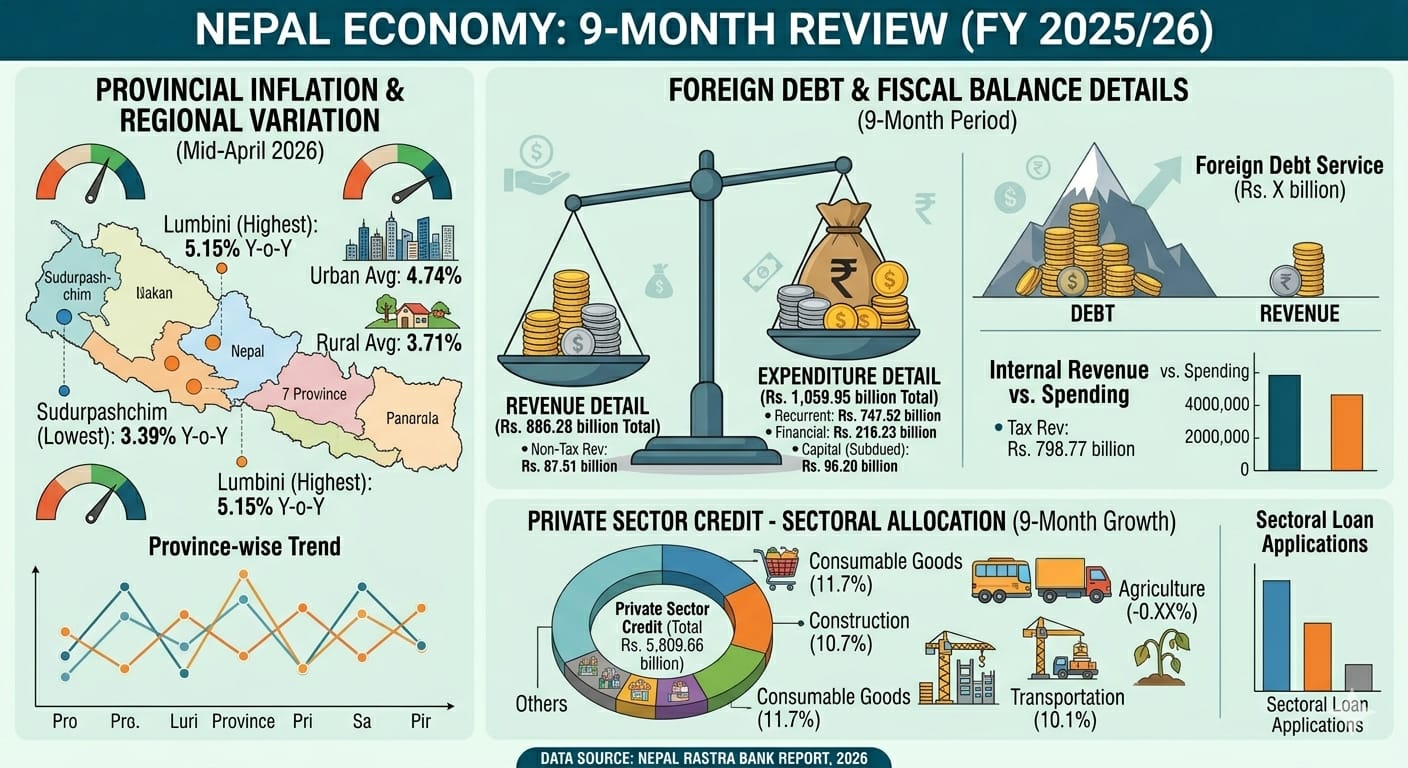
Rural inflation was 3.71 percent while urban stood at 4.74 percent. Province-wise, Lumbini recorded the highest at 5.15 percent and Sudurpashchim the lowest at 3.39 percent.
Wholesale price inflation moderated to 3.92 percent. These trends indicate manageable price pressures despite some sector-specific rises, supported by stable overall economic conditions.
How strong are Nepal’s foreign exchange reserves and what do they mean for the economy?
Gross foreign exchange reserves reached Rs. 3,494.73 billion (USD 23.55 billion) by mid-April 2026, marking a 30.5 percent increase from mid-July 2025.
This robust position covers prospective merchandise imports for 21.8 months and combined merchandise and services imports for 18.4 months.
Reserves held by NRB grew 27.7 percent to Rs. 3,082.41 billion, while those with other banks and financial institutions rose 56.8 percent.
The Indian currency share stood at 20.4 percent. Key ratios improved significantly: reserves-to-GDP at 57.2 percent, reserves-to-imports at 153.1 percent, and reserves-to-M2 at 41.2 percent.
This strong reserve buffer provides substantial cushion against external shocks, enhances import capacity, supports currency stability, and reflects healthy inflows from remittances and overall balance of payments surplus.
What drove the surge in remittances and its impact?
Remittance inflows increased sharply by 39.1 percent to Rs. 1,659.41 billion in the nine months, compared to just 10.2 percent growth a year ago.
In USD terms, they rose 31.9 percent to USD 11.55 billion. In the single month of mid-March to mid-April, inflows reached Rs. 209.75 billion.
This strong performance boosted net secondary income to Rs. 1,820.42 billion. The number of workers receiving first-time foreign employment approval was 294,186 while renewals stood at 293,259.

These higher remittances have significantly contributed to the current account surplus, strengthened foreign exchange reserves, supported household consumption, and helped maintain balance of payments surplus at Rs. 731.16 billion.
They remain a vital pillar of Nepal’s external sector stability.
How did Nepal’s merchandise trade perform during this period?
Merchandise exports grew 18.5 percent to Rs. 222.94 billion, with increases to India (22.6 percent) and other countries (5.1 percent), though exports to China fell 46.8 percent.
Key growth items included soyabean oil, cardamom, palm oil, jute goods, and noodles.
Imports rose 13.8 percent to Rs. 1,490.50 billion, driven by rises from India (7.8 percent), China (21.3 percent), and others (24.2 percent).
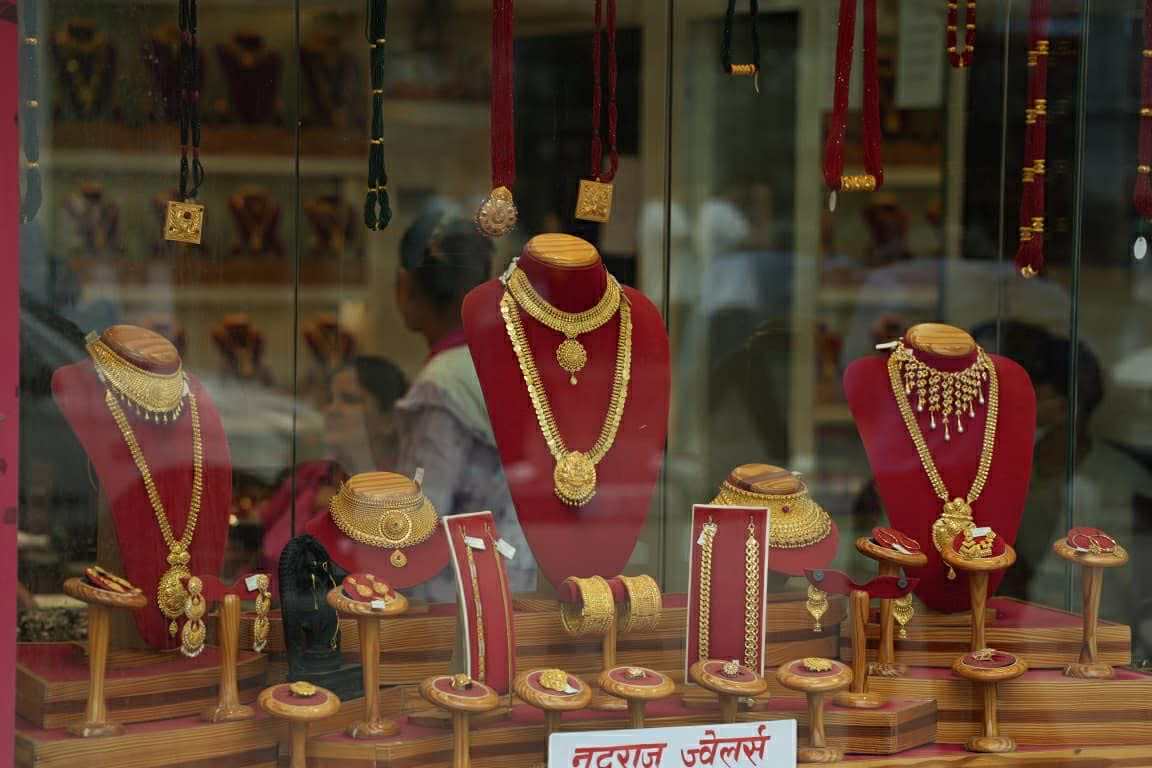
Major import increases were seen in chemical fertilizer, crude soyabean oil, silver, transport equipment, and petroleum products.
The trade deficit widened 13.0 percent to Rs. 1,267.56 billion, but the export-import ratio improved slightly to 15.0 percent.
Final consumption goods dominated exports while intermediate goods led imports. Terms of trade deteriorated 9.2 percent due to higher import prices.
What is the status of the current account and overall balance of payments?
The current account recorded a healthy surplus of Rs. 618.68 billion (USD 4.32 billion) during the nine months, significantly higher than Rs. 222.67 billion in the same period last year.
Net services showed a modest deficit of Rs. 67.54 billion, while travel payments for education rose.
Strong remittances and other transfers drove the positive outcome.
The overall balance of payments posted an even stronger surplus of Rs. 731.16 billion (USD 5.10 billion).
Net capital transfer and FDI inflows also improved. These surpluses reflect strong external sector performance, contributed to reserve accumulation, and indicate that Nepal is earning more foreign exchange than it is spending.
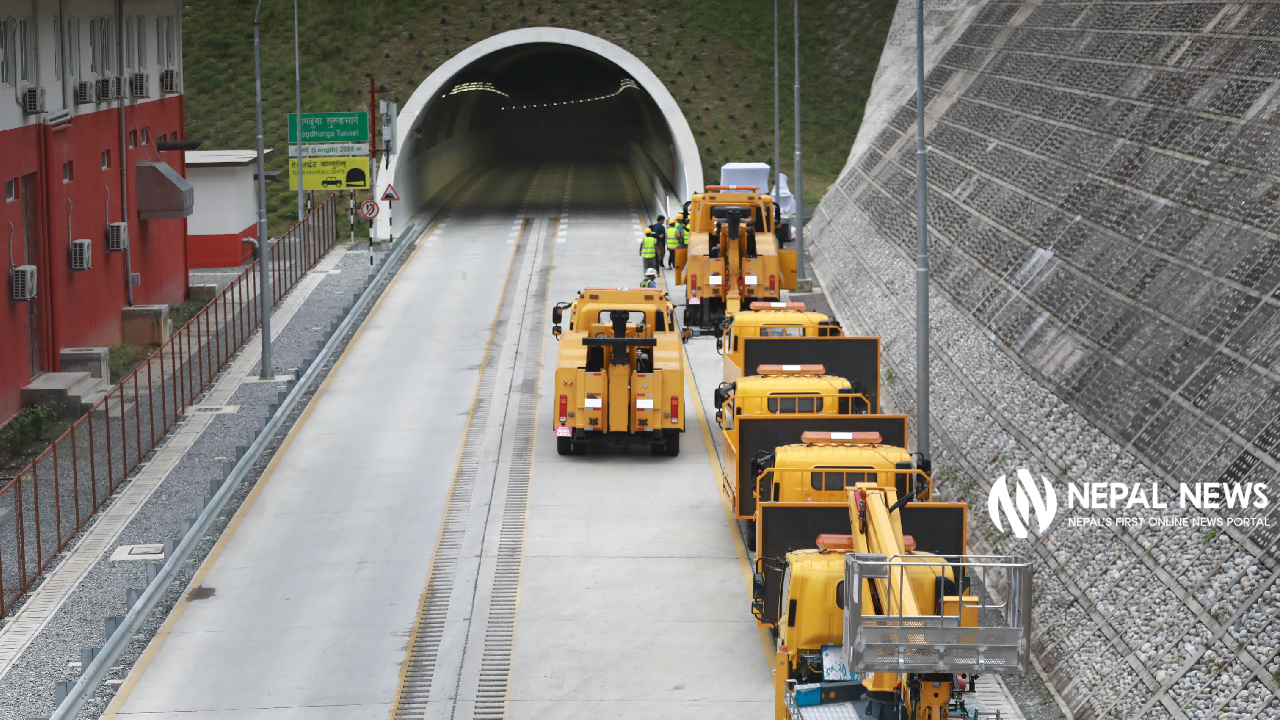
How did government finances shape up in terms of spending and revenue?
The Nepal Government’s total expenditure reached Rs. 1,059.95 billion, with recurrent spending at Rs. 747.52 billion, capital expenditure at Rs. 96.20 billion, and financial expenditure at Rs. 216.23 billion.
Revenue mobilization stood at Rs. 886.28 billion, including tax revenue of Rs. 798.77 billion.
This represents moderate growth in both spending and collection. The government maintained a cash balance of Rs. 429.17 billion at NRB.
Provincial governments spent Rs. 74.97 billion while mobilizing Rs. 149.15 billion in resources.
These figures show continued fiscal operations with revenue efforts supporting a large part of expenditure, though capital spending growth remained subdued.
What are the key trends in money supply and credit growth?
Broad money (M2) expanded by 8.1 percent during the review period and 14.5 percent year-on-year.
Deposits at banks and financial institutions grew 8.5 percent to Rs. 7,879.54 billion, with saving deposits gaining higher share.
Private sector credit increased 5.7 percent to Rs. 5,809.66 billion. Sectoral credit growth was notable in consumable goods (11.7 percent), construction (10.7 percent), and transportation (10.1 percent), while agriculture credit declined slightly.
Liquidity was actively managed through absorption and injection tools.
These moderate growth rates indicate controlled monetary expansion aligned with economic needs while maintaining financial stability.
How have interest rates evolved and what do they signal?
The weighted average interbank rate stood at 2.75 percent and 91-day Treasury bill rate at 2.61 percent by mid-April 2026, both lower than a year ago.
Commercial banks’ weighted average deposit rate fell to 3.40 percent and lending rate to 6.77 percent.
Base rates also declined across bank categories. These lower rates reflect ample liquidity in the banking system and successful liquidity management by NRB. Reduced borrowing costs could encourage investment and economic activity while still maintaining positive real rates given moderate inflation. The environment suggests easing financial conditions supportive of growth.
What are notable provincial and regional variations in inflation?
Inflation showed some variation across provinces in mid-April 2026. Lumbini Province had the highest consumer price inflation at 5.15 percent, followed by Koshi at 4.98 percent and Madhesh at 4.91 percent. Bagmati stood at 4.20 percent, Gandaki 3.85 percent, Karnali 3.82 percent, and Sudurpashchim the lowest at 3.39 percent.
Regionally, Terai recorded 4.83 percent, Kathmandu Valley 4.69 percent, Hill 4.18 percent, and Mountain 3.20 percent.
These differences likely stem from varying consumption patterns, supply chain dynamics, and local economic activities.
Salary and wage index growth also varied, with Gandaki showing the highest increase at 10.40 percent.
How stable is the banking and financial sector?
As of mid-April 2026, 106 banks and financial institutions operated with 11,401 branches.
Deposit accounts in class A, B, and C institutions reached over 62.4 million. Capital adequacy remained sound with core capital to risk-weighted assets at 9.72 percent and total capital at 12.62 percent.
The non-performing loan ratio stood at 5.60 percent, while the net liquid assets to deposits ratio was comfortable at 35.37 percent.
Credit disbursement continued across sectors with private sector credit growing steadily. These indicators suggest overall financial soundness despite some asset quality pressures, supported by strong liquidity and deposit growth.
What developments occurred in the capital market during this period?
The NEPSE index rose to 2,833.6 points from 2,662.1 a year earlier.
Market capitalization increased to Rs. 4,832.84 billion, equivalent to 73.23 percent of GDP.The number of listed companies grew to 294. Banks and insurance companies held the largest share of capitalization at 50.2 percent, followed by hydropower at 17.8 percent.
Securities worth Rs. 132.36 billion were listed, including ordinary shares, bonus shares, and mutual funds.
The Securities Board of Nepal approved public issuances worth Rs. 41.53 billion. These positive movements indicate growing investor confidence and gradual deepening of Nepal’s capital market.